


OpEx, Intraday post (20/march) + Fed path and tech (with geos)
Crucial post
FOMC officials highlighted increased uncertainty and a tilt toward stagflation. Growth forecasts were marked down to about 1.7% for this year, while inflation projections were revised upward for 2025.
Earlier, policymakers anticipated a “soft landing” in 2025, gradually lowering interest rates while controlling inflation and maintaining low unemployment. Now, the projections indicate that tariffs are likely to push prices higher, slow economic growth, and increase unemployment, making rate cuts less feasible in the near term.
Inflationary pressures stemming from tariffs are proving more persistent than initially anticipated. Powell emphasized that the latest inflation uptick is being driven by an external, tariff-related source.
They also announced a significant slowdown in quantitative tightening, from $25 billion to $5 billion per month, which supports a further decline in short-end yields and contributes to front-end spread widening.
In response, U.S. rates fell, the yield curve steepened on downside risks, and the USD depreciated slightly.
Powell’s press conference was considered more dovish than the SEP implied, with Powell dismissing some longer-term inflation expectations as outliers.
The SEP from the FOMC showed a heavy skew toward weaker economic activity and higher inflation risks. While median projections call for two 25bp cuts in 2025 and 2026, the dot plot’s distribution indicates substantial uncertainty, with many participants anticipating fewer cuts. This raises concerns that the Fed could be caught flat-footed if “transitory” inflation pressures persist.
Former Fed officials suggest that if tariff-induced price hikes become entrenched, the Fed may be forced to rethink its policy approach, potentially delaying or even foregoing further rate cuts.
The key point I want to emphasize is that the Fed’s dovish rhetoric is underestimating persistent inflation/stagflation risks. As I keep stressing, the negative wealth effect cycle is not over. However the market needs liquidity for further moves now.
For now, we can now see that the equity vs. long-term yields correlation remains highly positive. This is a direct result of bull steepening, driven by concerns about U.S. economic growth and expectations that any downturn is already priced in. Investors are anticipating further easing (keeping short-term rates low), while long-term yields remain anchored by longer-term growth and inflation expectations, hence the positive correlation.
Meanwhile, newspapers are starting to report that sovereign Middle Eastern funds are showing increased interest in U.S. tech stocks, and the U.S.–Russia gas extraction deal is also taking shape.
Ceasefire negotiations are also moving forward slowly, in a positive direction - as much as I’m allowed to tell you.
My post about geos is very important. This is what dictates the market as well. This is what is happening.
INTRADAY POST
Coding gamma for Friday AM expo:
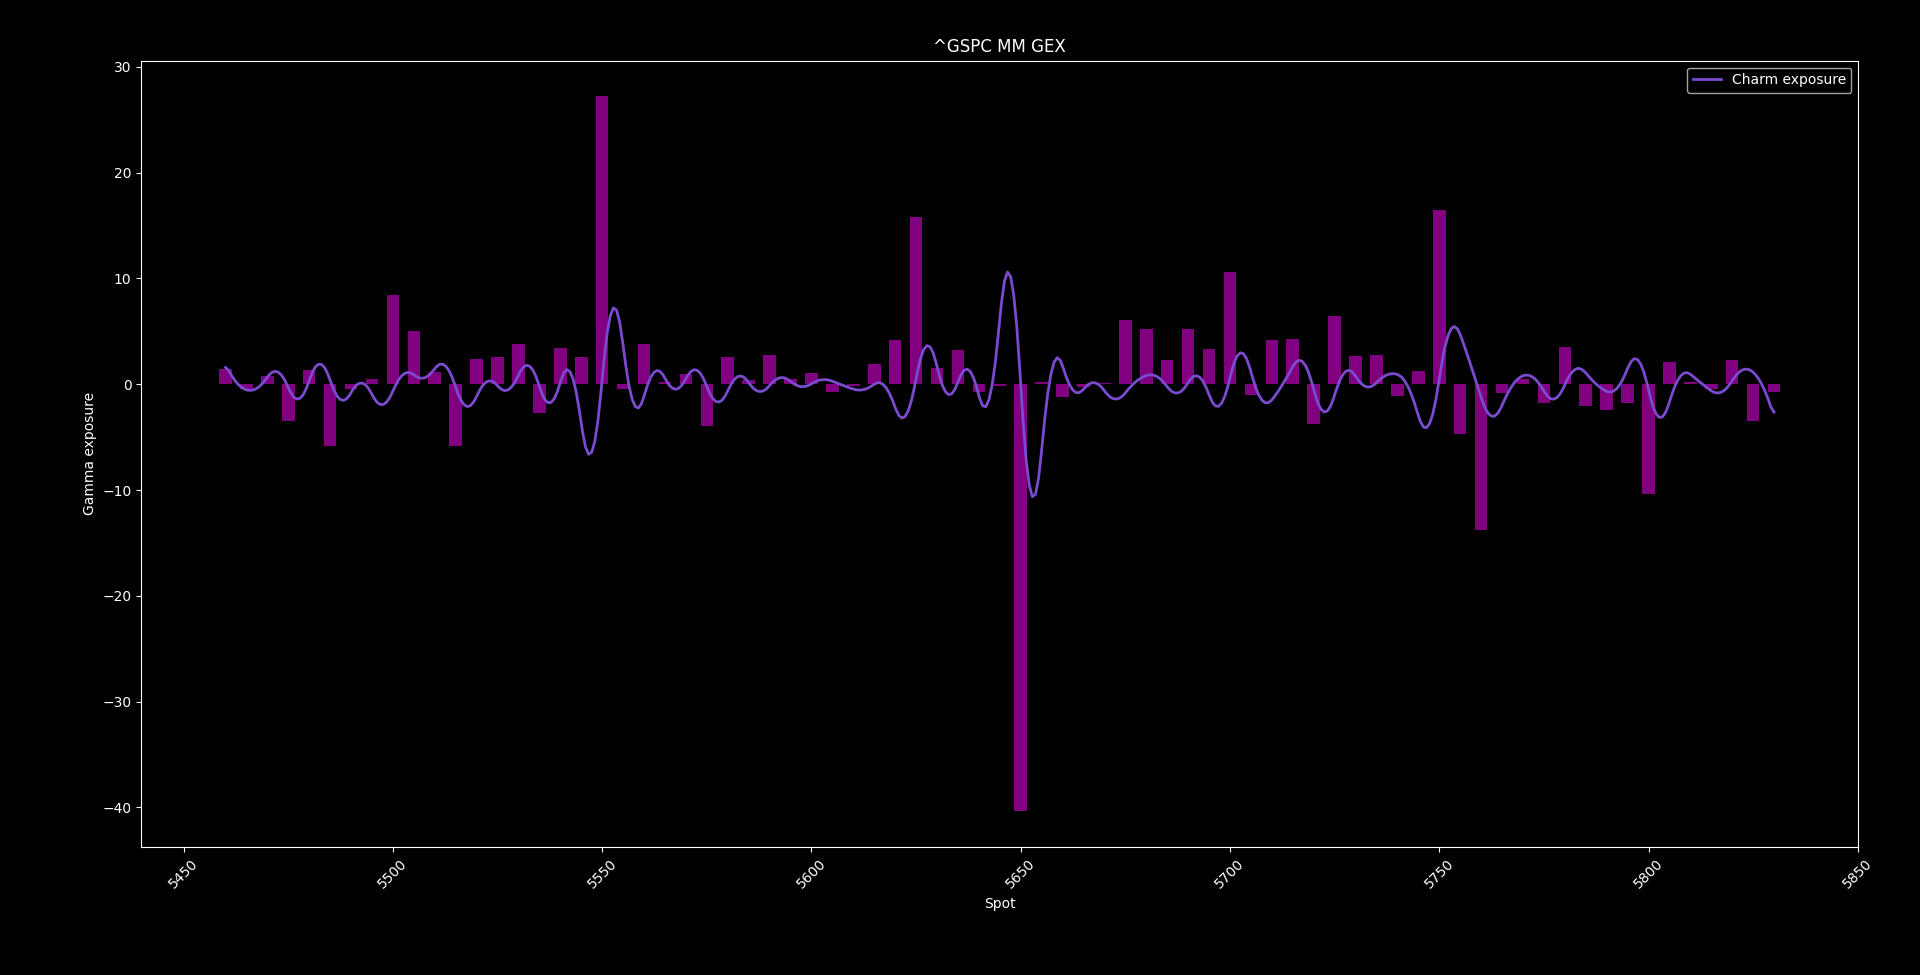
The speed profile is net negative to neutral, with a tail-to-tail slope of -0.13%, but only -0.08% from the midpoint toward tail calls and tail puts.
I’m coding 5595 as the level where puts should start to catch a bid in theory for significant downward strenght, and from there we should start to feel the longer downside gamma effect on the intraday vol profile.
Also coding 5680.43 as the level where calls should catch a bid; however, it’s a shorter upside gamma effect, but I don’t think it will significantly affect the intraday vol profile, since the speed exposure isn’t steep enough.
The main daily pivot is 5623.59, mark it.
The charm profile is net suppressive-to-neutral here, favoring a pinning at the daily pivot.
Locally, we also have a very mild positive color (charm convexity) that encourages intraday volatility to be compressed as gamma increases by the time. But remember, lower volatility leads to longer MM delta exposure.
At the same time, lower volatility reduces the vanna effect, so theoretically, this setup favors for an oscillating, slightly suppressive trend.
As I always say, any deviation will reveal the hands of the hidden customer flow. This is how we use the dealer profile.
The models show me that on a wider timeframe any mean‑reverting behavior in the price levels is even weaker now. While on an intraday basis it sees very strong mean‑reversion in the short‑term fluctuations.
So while the overall price level wanders (non‑stationarity per ADF), the intraday fluctuations are corrected rapidly. The overall regime remains stable, oscillating with a slight positive-to-zero drift.
Let’s look at tech alpha…
Here you can see the 20-day rolling tech alpha relative to the SPX benchmark. Below it are the ROC (Rate of Change) values of the alpha curve, as well as their weekly average.

We can see that the trend is similar to the behavior we observed last October–November. NVDA still hasn’t caught a bid, nor have AAPL, GOOG, or TSLA. MSFT, META, and AMD are leading the dance instead. For the trend to continue, it’s crucial that their “friends” catch up soon.
The reason is that NVDA and AAPL are heavily exposed to China, while the U.S. aims to strengthen its own manufacturing and reduce reliance on China—a country they ultimately want to push out of economic processes once the new “Holy Alliance” is in place.
The U.S. is adopting export controls, investment bans, and significant domestic R&D funding to limit China’s access to cutting-edge technologies like advanced AI chips and quantum computing. Meanwhile, China is investing billions in indigenous innovation to reduce dependence on Western technology, fueling a high-stakes investment race.
Quantum computing is emerging as a crucial frontier, with contributions from major tech giants (IBM, Google, Microsoft, Amazon) as well as pure-play startups (IonQ, Rigetti, etc.) and government-funded initiatives. There’s growing interest from Wall Street—seen in SPAC deals and large VC investments—to support companies that may eventually offer a strategic advantage. At the same time, geopolitical concerns are driving Western efforts to limit Chinese involvement in this sensitive area.
Saudi Arabia’s Public Investment Fund (PIF), led by MBS, is aggressively channeling vast capital into tech sectors (AI, semiconductors, quantum computing) by backing vehicles like SoftBank’s Vision Fund and making direct investments (e.g., in EVs and chip technologies). Other Gulf funds, such as Mubadala and ADIA, are also stepping up—often partnering with Israeli and Western investors. Strengthened by the Abraham Accords, these growing ties create a network where Middle Eastern capital now fuels innovation in regional hubs like Tel Aviv as well as in global tech centers.
OptionsDepth daily chart:

Coding 5683 zero vanna (low vol needed to break through it).
And 5535 zero vanna (high vol needed to break through it).
5739.5 is needed to break in order to get gamma support for stabilization.
5610/5601 is an important support are. If vol can calm down here, price can be stabilized.
The net gamma is negative locally. Below the 5683 zero vanna line MMs are short vanna, just as I said above.
In theory, intraday spot/vol beta should catch a bid below the vanna flip.
VIX key pivot is 23.93 to the upside and 19.21 to the downside.
As expected in the weekly post, customers are slightly shorter skew into Friday:

The tendency remains intact (hence slightly negative speed profile).
SCRIPT INPUTS:
SPX
99.73%, 5803.70994570753, , 5771.5156752098665, 95.4%, 5739.499992385015, Risk level, 5718.567547601875, 68.2%, 5707.30471728836, 68.2%, 5643.093736505012, Risk level, 5632.012530523125, 95.4%, 5611.080085739985, , 5578.882732070426, 99.73%, 5546.87013241747
ES=F
99.73%, 5862.302589327331, , 5829.070247905415, 95.4%, 5796.026294663665, Risk level, 5774.42022260331, 68.2%, 5762.792869941547, 68.2%, 5696.515466770091, Risk level, 5685.07977739669, 95.4%, 5663.473705336335, , 5630.238037500838, 99.73%, 5597.197410672669
SPY
99.73%, 580.5414373439592, , 577.1788408582494, 95.4%, 573.8357211133858, Risk level, 571.6496576222189, 68.2%, 570.473010156455, 68.2%, 563.7671767314865, Risk level, 562.6103521434061, 95.4%, 560.4242886522392, , 557.0613404850003, 99.73%, 553.7185724216658
VIX
99.73%, 22.73402460635389, , 22.014119966471572, 95.4%, 21.317012112442082, Risk level, 20.855066039426834, 68.2%, 20.59632328610625, 68.2%, 19.178410693517005, Risk level, 18.944933197633713, 95.4%, 18.482987124618464, , 17.760354426880575, 99.73%, 17.065974630706656
IWM
99.73%, 212.60333630203556, , 211.03924763098604, 95.4%, 209.48666570961154, Risk level, 208.4706310964813, 68.2%, 207.9224907979135, 68.2%, 204.80573134003734, Risk level, 204.2693591378937, 95.4%, 203.25332452476346, , 201.688969135672, 99.73%, 200.13665393233944
QQQ
99.73%, 495.37151551976604, , 491.73781313982187, 95.4%, 488.13076508410177, Risk level, 485.7702804420752, 68.2%, 484.4968635312789, 68.2%, 477.2559078790981, Risk level, 476.0097488547998, 95.4%, 473.64926421277323, , 470.0149459039582, 99.73%, 466.40851377710896
NQ=F
99.73%, 20332.14029520839, , 20185.262202389684, 95.4%, 20039.445147604198, Risk level, 19944.02652948523, 68.2%, 19892.559248836063, 68.2%, 19599.85606213849, Risk level, 19549.47347051477, 95.4%, 19454.054852395802, , 19307.152631693327, 99.73%, 19161.35970479161
NVDA
99.73%, 125.2627196239445, , 123.31184719501663, 95.4%, 121.39135813350546, Risk level, 120.12929428762233, 68.2%, 119.43999330352808, 68.2%, 115.56810642052523, Risk level, 114.91069899851048, 95.4%, 113.64863515262735, , 111.69618311510992, 99.73%, 109.7772736621883
AMZN
99.73%, 204.1338777729742, , 201.9739799378019, 95.4%, 199.8369355295535, Risk level, 198.43613235819836, 68.2%, 197.67678930964618, 68.2%, 193.37958764283132, Risk level, 192.64385421406726, 95.4%, 191.24305104271212, , 189.08237418474337, 99.73%, 186.94610879929144
AAPL
99.73%, 223.28941063237963, , 221.26790873467644, 95.4%, 219.26470806277186, Risk level, 217.9526550250797, 68.2%, 217.24303663843412, 68.2%, 213.21815814209296, Risk level, 212.52735596124842, 95.4%, 211.21530292355627, , 209.1932728762393, 99.73%, 207.1906003539485
GOOG
99.73%, 172.71735382637584, , 171.1004466624776, 95.4%, 169.49867630283637, Risk level, 168.4493874301625, 68.2%, 167.88162403529478, 68.2%, 164.66279573527797, Risk level, 164.11061012843126, 95.4%, 163.06132125575738, , 161.4439614231166, 99.73%, 159.8426437322179
TSLA
99.73%, 257.87987435013605, , 252.3148597649992, 95.4%, 246.8699374802438, Risk level, 243.28069806065895, 68.2%, 241.30218317447472, 68.2%, 230.2892445839847, Risk level, 228.43930316004418, 95.4%, 224.85006374045932, , 219.2760045174002, 99.73%, 213.84012687056705
TSM
99.73%, 183.08064255626795, , 180.73546016720275, 95.4%, 178.42031853155194, Risk level, 176.90105289949452, 68.2%, 176.07473858549494, 68.2%, 171.41399538567708, Risk level, 170.61893611417736, 95.4%, 169.09967048211993, , 166.75322875507436, 99.73%, 164.43934645740393
AMD
99.73%, 111.82875220853357, , 110.42019412913523, 95.4%, 109.02937778273358, Risk level, 108.11678171992278, 68.2%, 107.620588958917, 68.2%, 104.82097146355818, Risk level, 104.3432249939444, 95.4%, 103.43062893113361, , 102.02134062839808, 99.73%, 100.63125450533362
Excellent post. Thx