


Fed, Distribution, Revision of weekly post + Intraday post (25/June)
Free short education on distribution
Fed
Powell reaffirmed a “wait-and-see” approach as expected, unwilling to look through tariff-driven price increases until clearer data on pass-through and magnitude arrive. He signaled rate-cut flexibility later this year—“sooner rather than later” if inflation remains contained—but declined to target a specific meeting, leaning toward a September cut over July. Market prices only 15.9% probability to hold rates. A significant majority of FOMC participants penciled in cuts later this year under scenarios of subdued inflation or labor-market weakness.
Also, the LEI dipped 0.1% in May 2025 to 99.0, marking its sixth consecutive monthly drop and triggering the Conference Board’s formal recession signal. Although the Board does not forecast a recession, it expects a significant growth slowdown, projecting ~1.6% real GDP growth for 2025.
Fed policy moves hinge on June and July inflation prints. They aren’t yet ready to ‘look through’ tariff increases without clearer data on their size and pass-through to consumer prices.
The divergence is shady. Downside remains managed for now, but Augustus window will be a surprise and pivot.
Distribution
I try to explain this through tools you can also use without purchasing thousands of datas to model vol surfaces…
So, a little bit of theory here first.
At the beginning there was the constant volatility and normal distribution mathematically measured by vega.
But vega has got a convexity as tail OTM contracts (let’s say ~5-10 deltas now) get higher risk premium, because higher change in IV elevates the risk for the seller that the contract will end up ITM, elevating the kurtosis (“tailedness” or the propensity for extreme values) of the distribution, so as a result this draws the known vol smile.

This vega convexity is called vomma or volga (vol gamma).
But the distribution is not symmetrical at all, it’s median, mode and mean are constantly moving. Equity markets typically have occasional large negative returns, occuring more often than a Gaussian model predicts, I wrote an educational post about it. Thus, left tail is fatter, and skewness is negative.
As a result, investors and traders spend more on buying downside protection than betting on upside, and this skewness appears in the vol surface too, creating the smirk (“left-skewed smile” basically).

What we are seeing is basically that, as we slide left or right on the x-axis (spot), we get higher/lower vol risk premium. This change of vol vs spot, and thus the skewness is described by vanna. This convexity is highest typically at the 15-35 delta ranges (I like 22 deltas to measure vanna).
Here you can see the past one month, simplified:

We can see leptokurtic behavior (kurtosis of 0.8605, but moderate-excess as 1 > kurtosis > 0), and also fatter right tail with skewness of 0.644542, while downside moves are clipped by mean reversion.
The kurtosis was higher after Friday close and skewness was lower than today. This is the realization of the short vanna and vol of vol supply dynamics I was writing about. Scrutinizing the trend in the numbers as I code the “rolling realized distribution”, Monday was a pivotal day, squeezed right to the marked weekly level that I provided as the border of the downside gamma “gravitational field”, and interestingly it showed that Tuesday was a squeeze, but moderated as right tail was actually sold a bit, that flattened the short vanna regime.
We can also see this tendency in the past month looking simply at the SPX/VIX realized beta making higher lows and catched up a bit after yesterday session:

And if you look at the realized vol didn’t broke its support yet, vol of vol remains suppressed, while RV realized up by an insignificant 0.11 step from 12.88% to 12.99%

Now, I scrutinized the rolling distribution of VIX too…
The skewness monoton fell since Friday, while kurtosis kept going up.
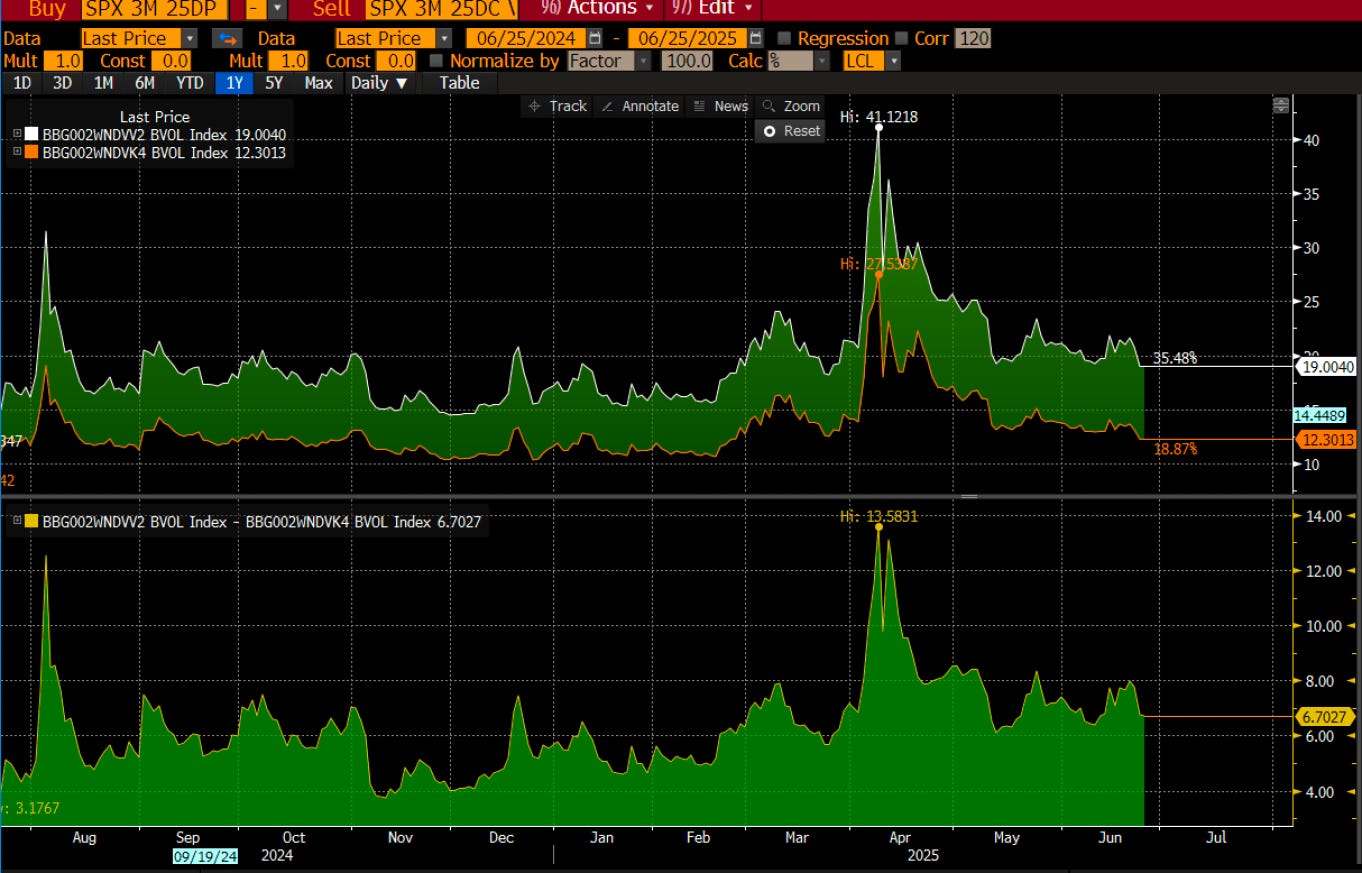
Shorter-dated options have more vomma, while medium-term it is vanna effect that dominates. This reinforces the SPX tail put selling bcs it means that VIX traders sold the right-tail and also explains why both SPX/VIX beta and SPX RV catched up a bit, on this yesterday squeeze. But also don’t forget, that in the near-term, traders buy VIX vomma, telling me, they expect a sharper move in the VIX IV in the near-term, potentially down, because they buy downside VIX vega and sell upside. This would create a vaccum effect at the SPX upside tails, while compressing the SPX short vanna range (pushing the flip zone down). I think this is what we are seeing materializing now. And if I’m correct, we should see VIX IV selling below 17s - 16.5s, and that would shift the SPX regime and stabilize the price upward around 6120 even 6170 (some output even told me 6240… not that irreal given the coming July 4th). But this squeeze should happen here around 6100 to get the unclench. This would be reinforced by the accumulated negative zomma too.
If not, I will short only, when my model shows, will signal in real-time. Otherwise it will just chop.
And that would be the squeeze I’d be short. Reversion model doesn’t give red dot yet.
We are in a negative-to-neutral, flat-short vanna regime, market is illiquid at these levels. Algos are trading, while VIX is foreshadowing a regime shift up.
But vol selling now still caps upside, and elevates the odds of retesting the weekly upside bound at 6024/34 zone.
Reassuming weekly post
What’s behind the squeeze? 1) Managed war risk premium, as said, that got unwound as Putin came to mediate between US and Iran as it was foretold in March as a part of the slowly-forming US/RUS alliance (Putin-Xi negotiation is next soon to solve US trade war), and 2) artificially created optimistic outlook for growth, even shifting sentiment towards “bad news are good news”, even tho metrics show that the underlying concern is still the recession, and August. They will try to solve it.
August-Sept window will be the pivot for bear-market.
I marked 6024 and 6034 as the lvls for the week, below the effects I described was in effect, along with steady geo risk. These levels were broken during the overnight, when ceasefire agreements were managed in the Middle-East, through the Russians.
The thing I overestimated when I was writing the weekly post, is the unwound and profit taking effect. It literally flattened the skew positions as I showed above, and pushed the market into a flat-to-neutral vol regime.
Market should break below 6048.96 daily in order to get back into the previous regime. No short yet.
We have GDP and PCE datas tomorrow and on Friday. No trades in an illiquid algo-mess… We made enough through the last weeks…
Market is literally in a regime shifting-repricing mode.