

Window of Risk, Disbalance - Investigating the story that the market tells
"Market has become more fragile than it seems" / Asymmetric drawdown risk
Earlier window of risk calls
After the April crash my primal window of risk was the May ECB rate decision to mid-May (Trump visit to ME) window.
We had a ~97 pts decline but the market didn’t broke my target from where the momentum could have shifted to left-tailish.
Later, a 124 pts decline materilaized after Trump’s visit, but it wasn’t the risk I expected, it was strictly derived from the weekly positioning with an exact target. Same as with the June 16-20 week with its 107 pts decline.
The next, and basically my (orignial) major window of risk was the July/August window, post-NFP and FOMC period after tariff effects start to appear in the datas. It was clear since April. I marked it into mid-August. They indeed started to appear in the datas, and we got a 215 pts decline, still didn’t broke my target, that would have triggered the left-tail risk that I kept mentioning. Later, mid-August, another 138 pts decline happened, but still didn’t broke the structure.
(I add here that it started to be clear for me during mid-July that the market will remain supported, and I emphatized that my window of risk is shifting towards post-Sept OpEx period)
The current window of risk is from post-OpEx Tuesday to October buyback window (as 75% of SPX market cap is in blackout by early October, and funds like to de-risk).
Before I jump into the reasons, let me tell you…
…what is the problem?
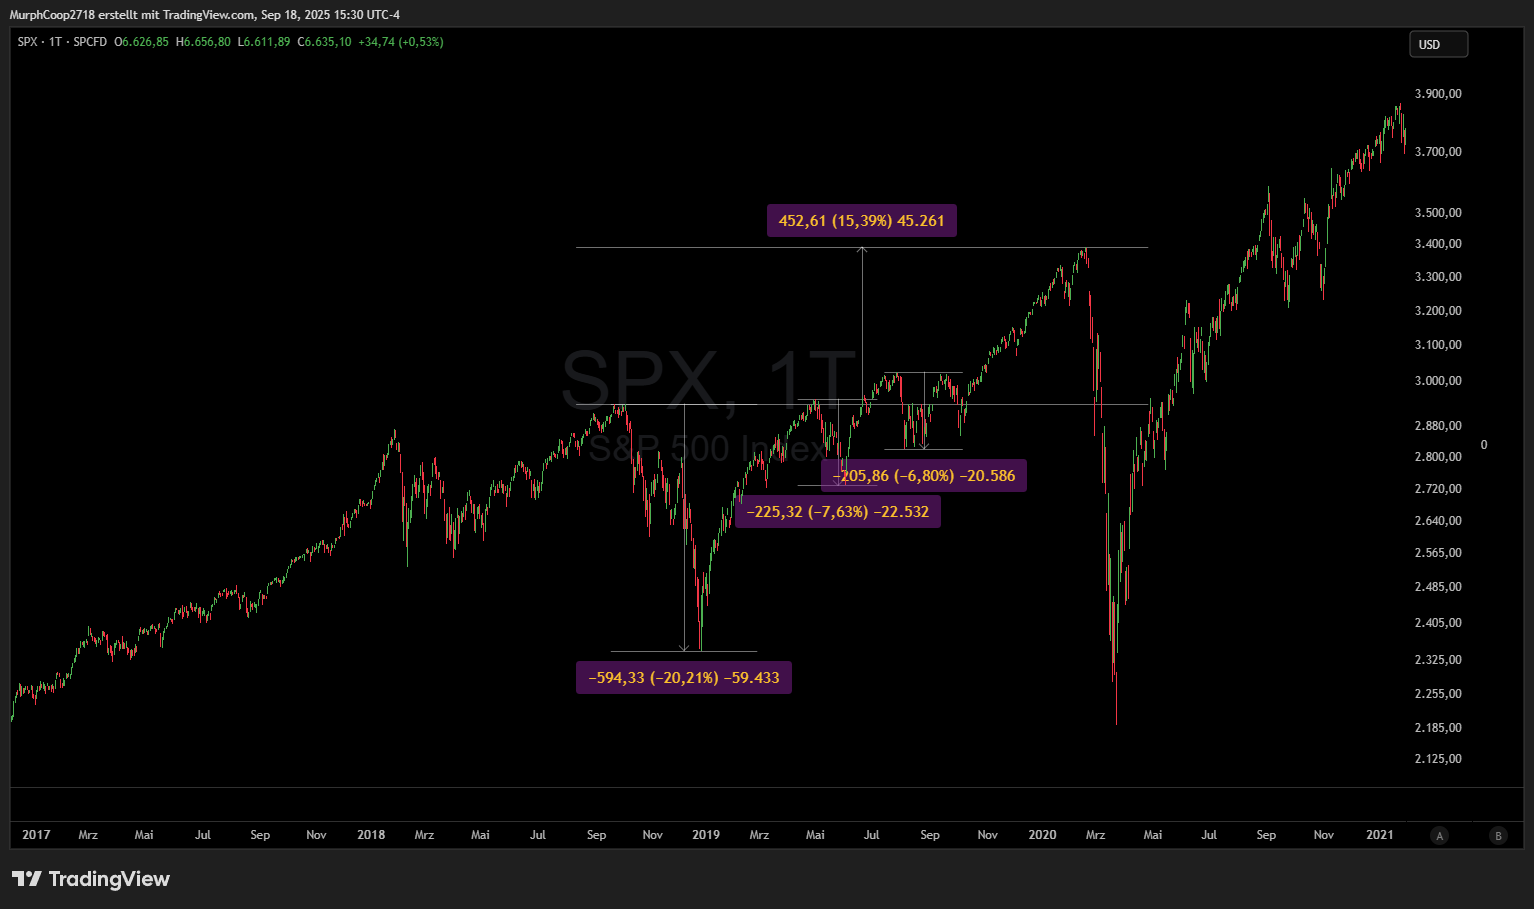
Trump’s first admin produced a market performance of this kind:
And the Covid-crash rebound looked like this:
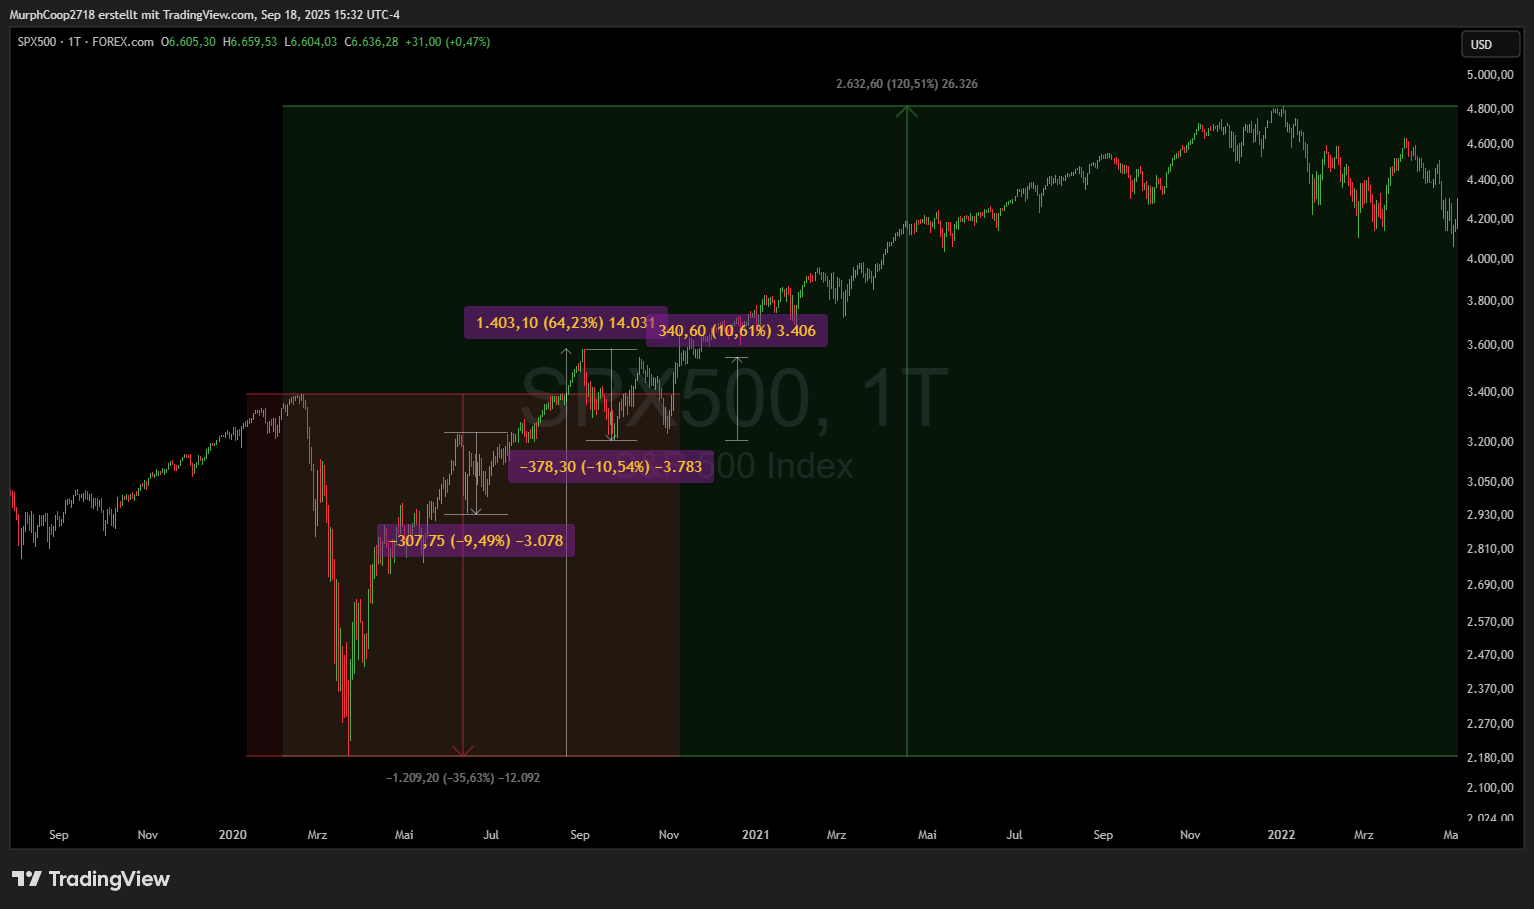
As you can see, the post-Covid rebound wasn’t as quick as it looks first. It produced three more than 9% drops. After the 2018 pullback of 20.21% range the market also experienced 6-7% pullbacks that were higher than proportional compared to the Covid-rebound. In both case, they happened in the following 8 months period before taking out the ATH.
Proportionally, it would be like if we would have gotten some 5-6% pullbacks after the current 21.35% April crash before taking off the February all-time-high around December/next-January.
And because velocity is the ratio between the path and the time, this is why people say, this rebound is simply just too fast. It feels instable for literally anybody because of its velocity and lack of gap-fillings, and retested structure of liquidity.
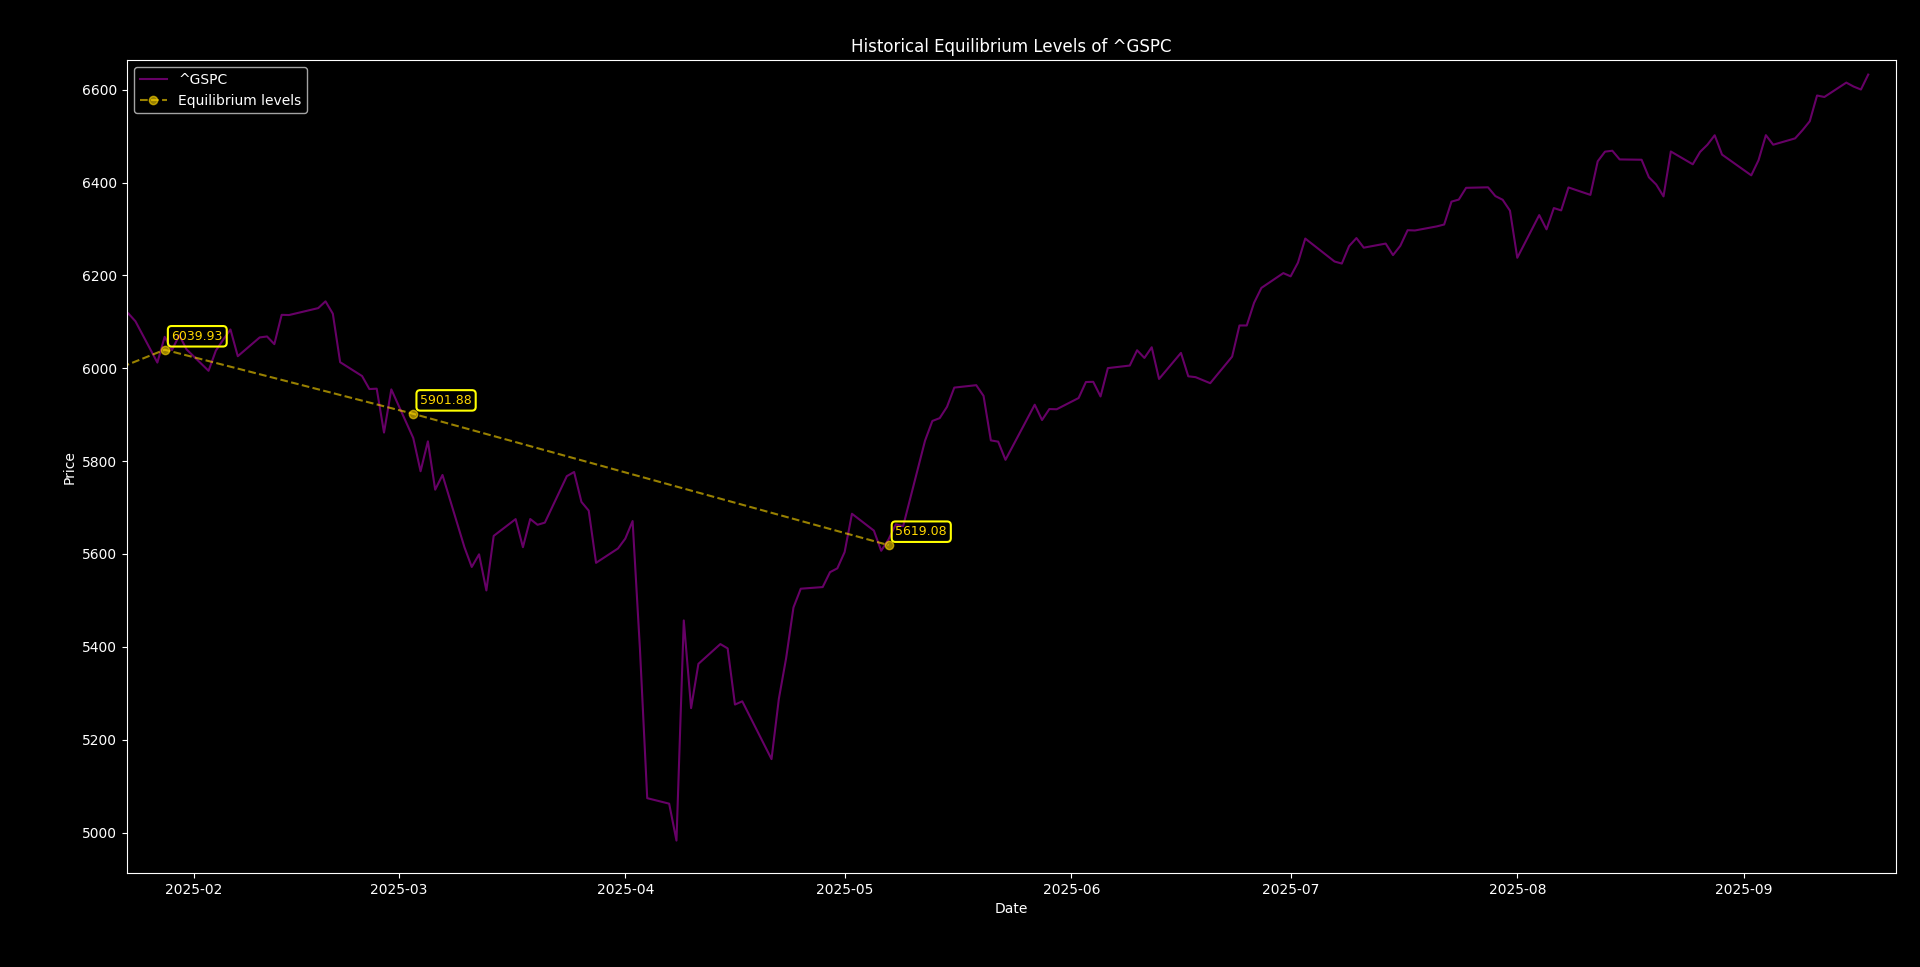
At the first look, you may think that the momentum is heavily imbalanced. But it is not quite true. The purple line shows us the accumulated imbalances:
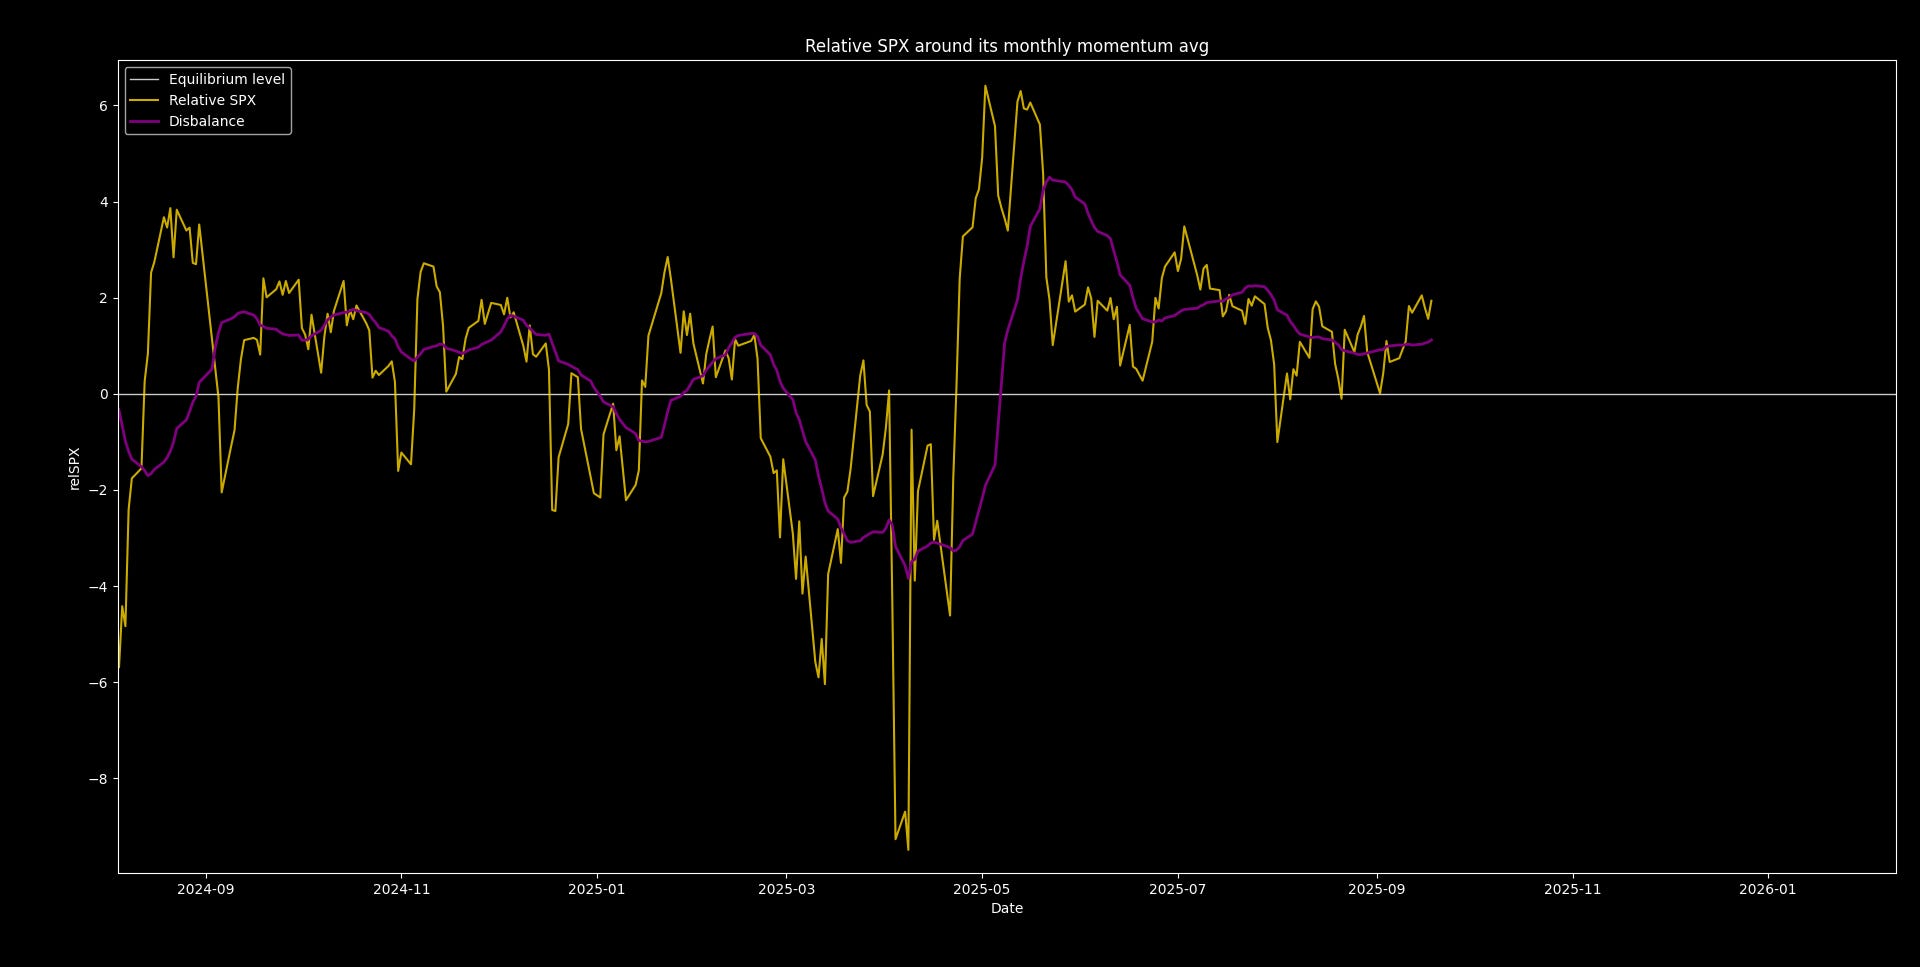
As you can see, the time correction ate up a significant % of it, but not all of it. The returns are not that overstretched as they may appear on the price chart.
Just for comparsion, the Covid-rebound and the 2021 bull run looked like this:
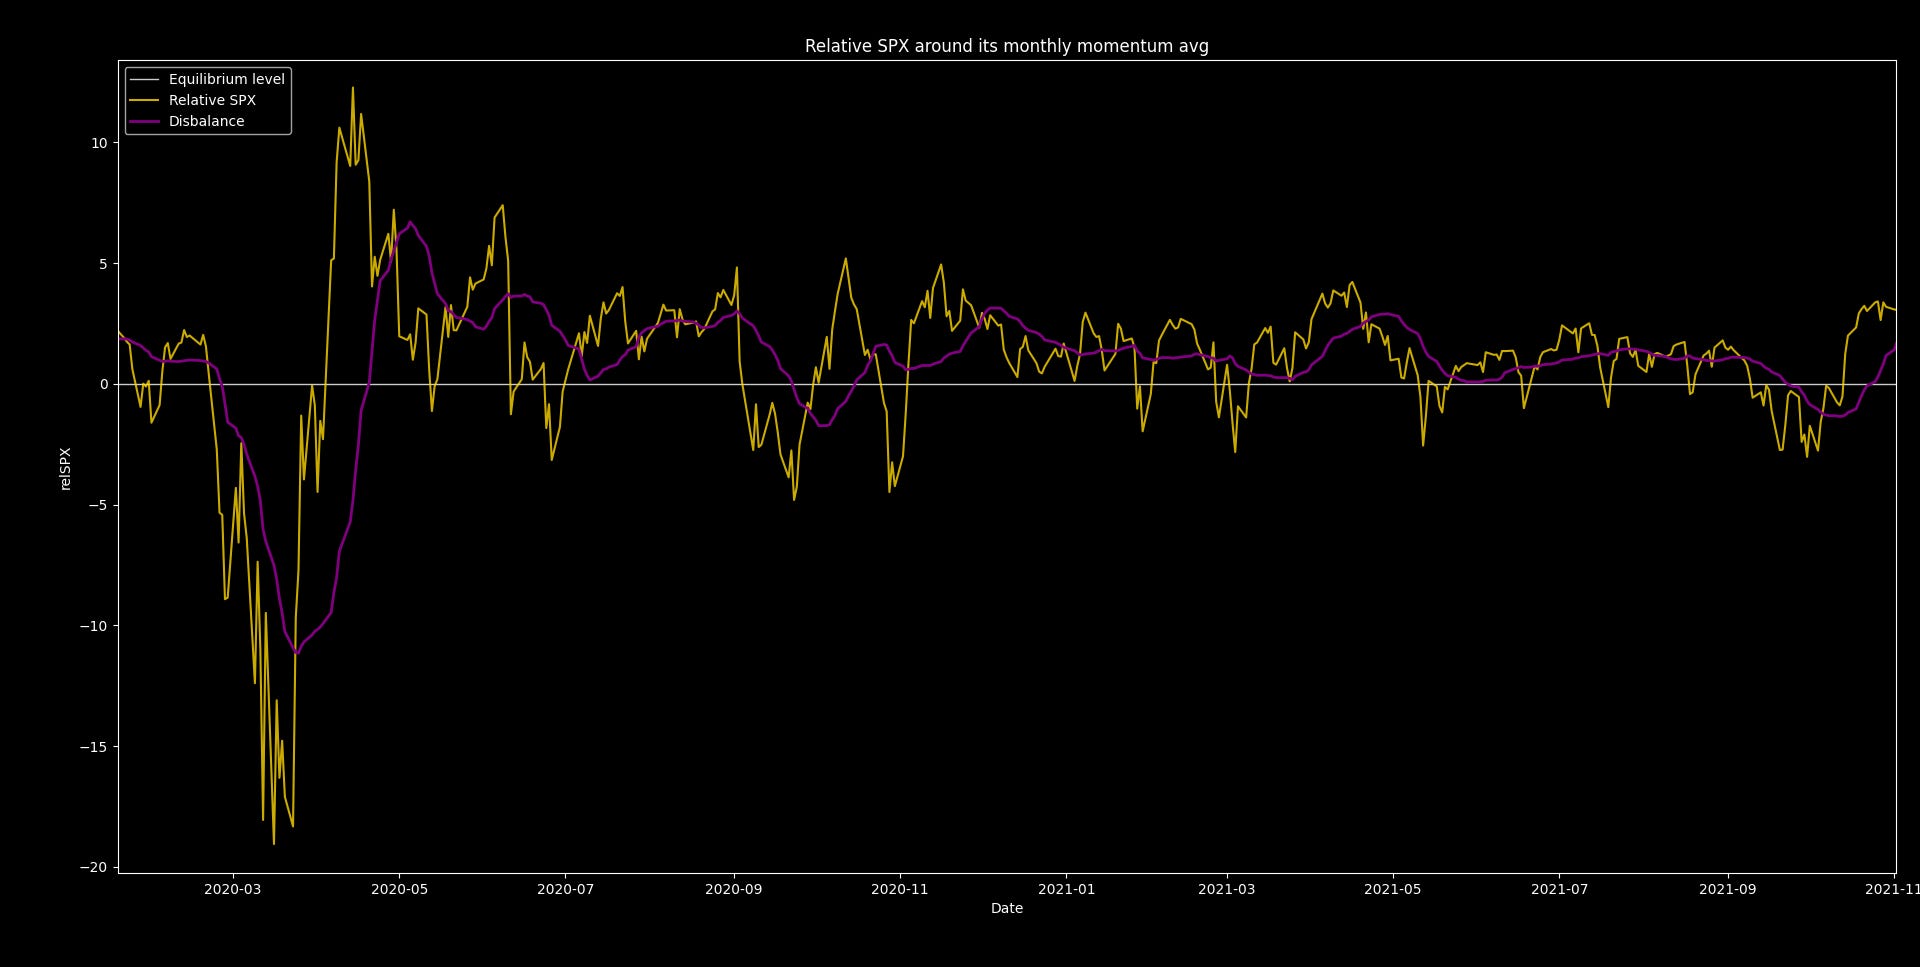
The imbalances were moderated pretty fast and were kept on a relatively low level during 2021 using time correction.
The Feb-April selloff did nothing momentum wise but took back all the 2024 imbalances when it reached 5901.88, created a sharp negative disbalance that were also rebalanced when it rebound to 5619.08
What I want to say with all of these, is that the market is not as disbalanced as it may first seems. So, the risk that the different mean reversion algorhytms are meassuring, running on the wrong assumptions (moving averages, gaussian z-scores, exponential growth assumptions or different fair value assumptions) misjudge the trend.
If momentum is carefully slowed down, the effect of time correction can mitigate all of these risks coming from assumed disbalanced returns. But, the key takeaway here is that, even knowing that the market has relatively more uncorrected disbalance than it was after past crashes, it is at a level that can be easily managed.
The risk doesn’t emerge from momentum, it emerges from something else…
What is the risk?
The force that pushed this market even higher in this agressive manner is structural flows.
My subs know that day after day, week after week, we keep seeing dealers profiles with negative speed exposures, positive vomma and zomma exposures and pricings that collect the premiums from short sellers.
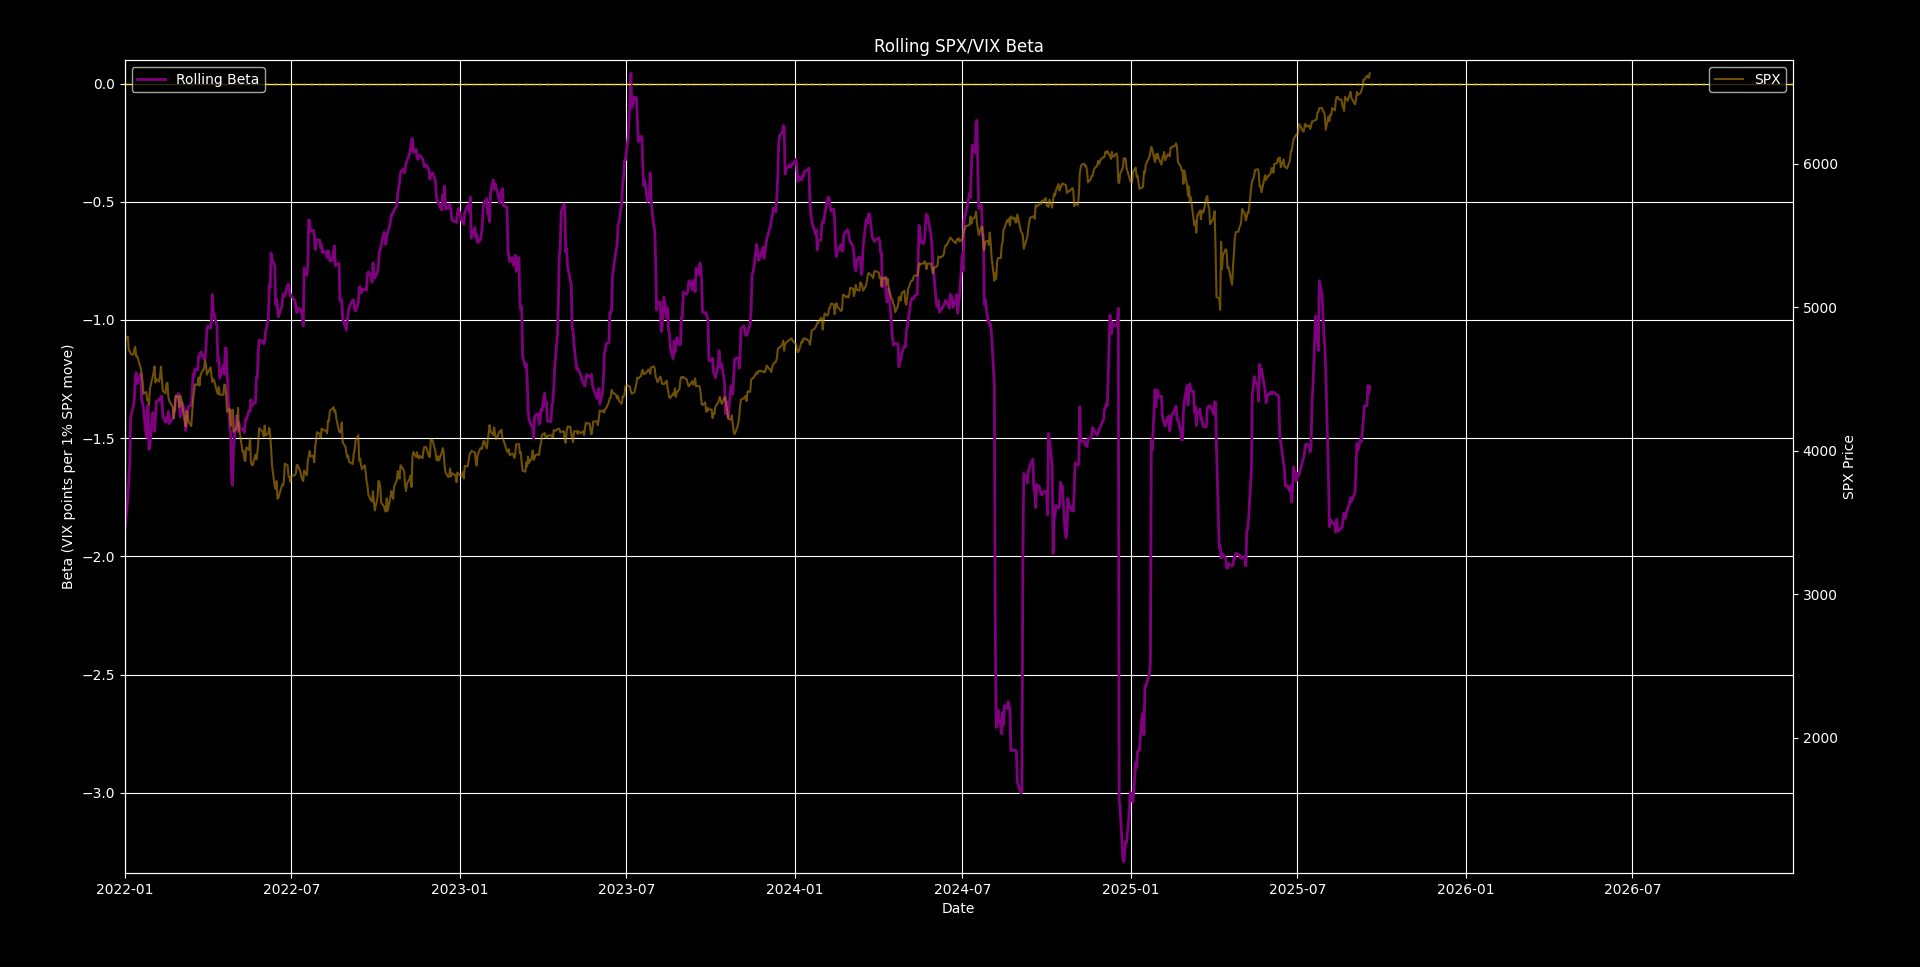
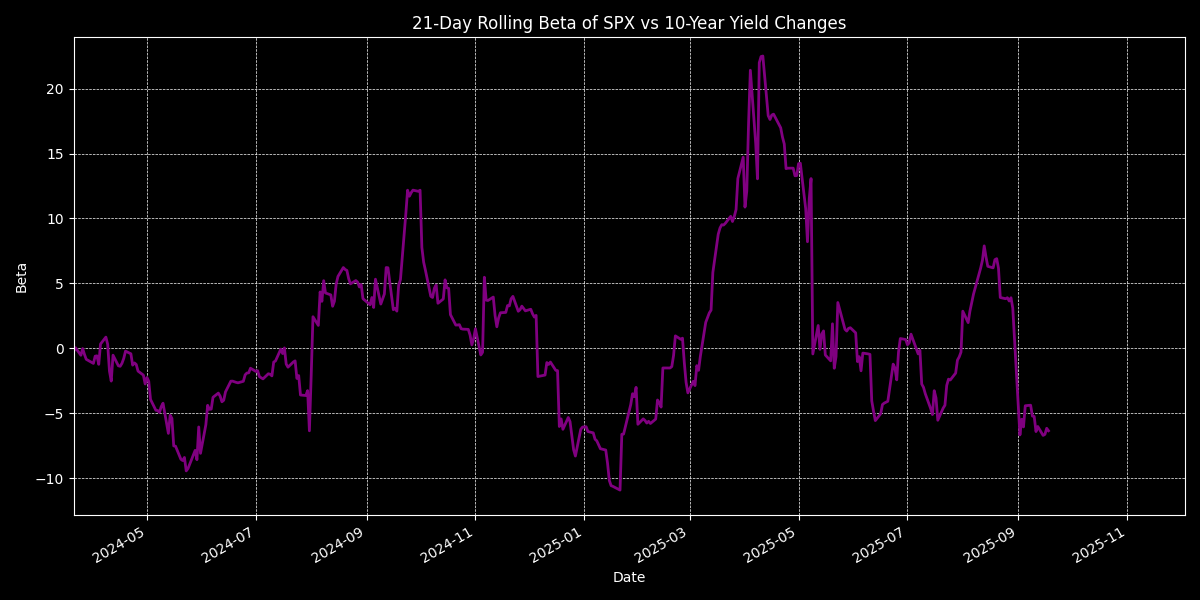
Meanwhile the stock-to-bond correlation is sharply positive on the monthly tenor, SPX/VIX beta is also getting longer since the August sell-off, while investor portfolios keep showing outflow into bonds, cash and other safe-havens.
The purpose of the concentrated and agressive negative speed profile is to overwrite the growing SPX skew (net longer vanna) since 2024 June (roughly) on the short-run. What it generates is a short-term positively skewed implied distribution, that generates liquidity usually just right below the spot, and creates a less-resistant but more illiquid paths upward, supported by dealer hedging flows. (This is what I like to call as “stunt mats” below the spot)
We also keep seeing the constant vomma supply, that does nothing but dampens the tailedness of that implied distribution. Doing this by literally making the volatility to rangebound, not letting it to make sharp moves (it does almost the same to volatility, that gamma does to the momentum, hence its other name: “volga” that is VOLatility + GAmma). What it takes is locally not letting upside gamma squeezes to materialize in a violent fashion, basically producing a “braking-effect” on any upside moves and short squeezes. Also, to the downside it doesn’t let the vanna to wake up the put hedges on different tenors, so those get mostly closed or let to expire worthless, providing further mechanical buyback flows.
Zomma is also shifting to positive as we moving upward, that is a clear sign that we have reached the far right wing of the curve. The system is designed to not let volatility to be suppressed or expanded forever, and zomma is the force that can have an ultimate stopping effect on vol if not anything else.
(Again, zomma is capping the volatility by braking the momentum because zomma is the relationship between volatility and gamma, so if vol goes up, the upside gammas start to increase, thus as a result the local dealer hedging flow kicks in and swallows most of the volatility and braking down the momentum. Doesn’t necessary stop it, but brakes it down… it is the vol expansion/suppression that it is designed to stop through the momentum.)
The other structural flow is generated by the agressive volatility suppression:
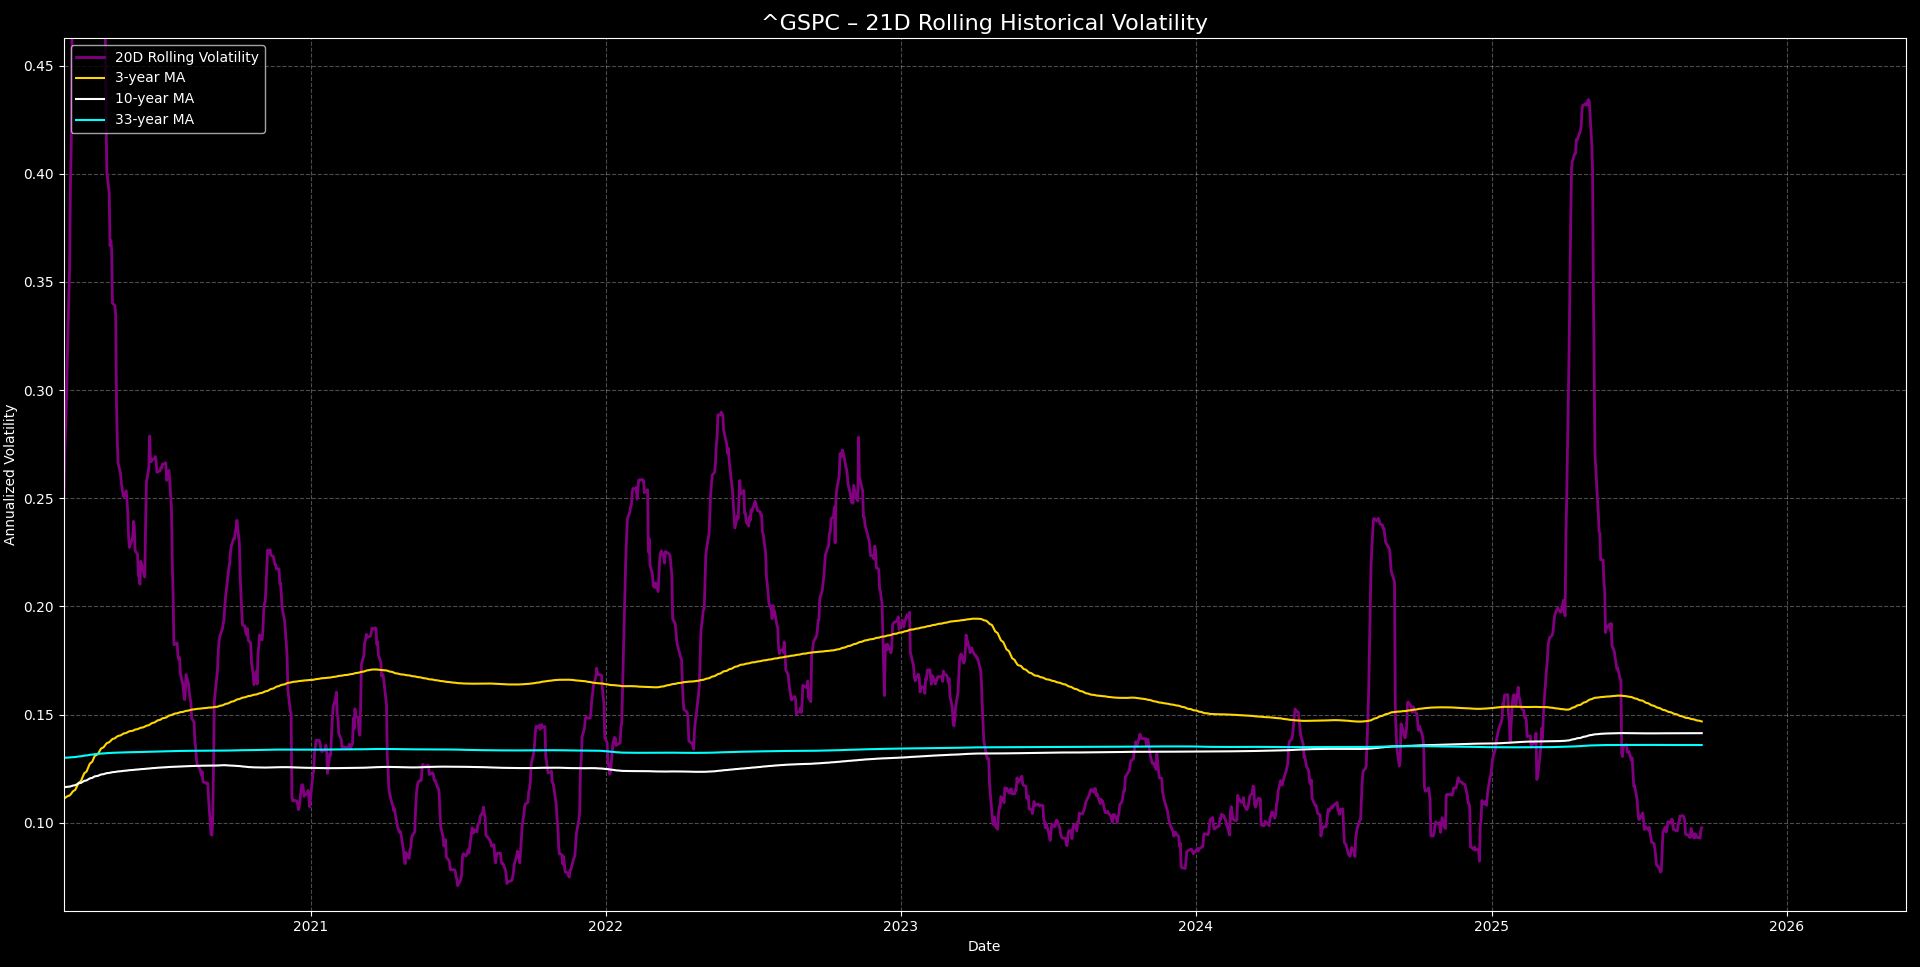
After volatility mean-reverted sharply and too fast (momentum-wise), it was set to rangebound through the constant vomma supply, currently at 9.76%.
VIX was shorted down by 76.17% during the past 5 months, that is literally the fastest decline in its record.
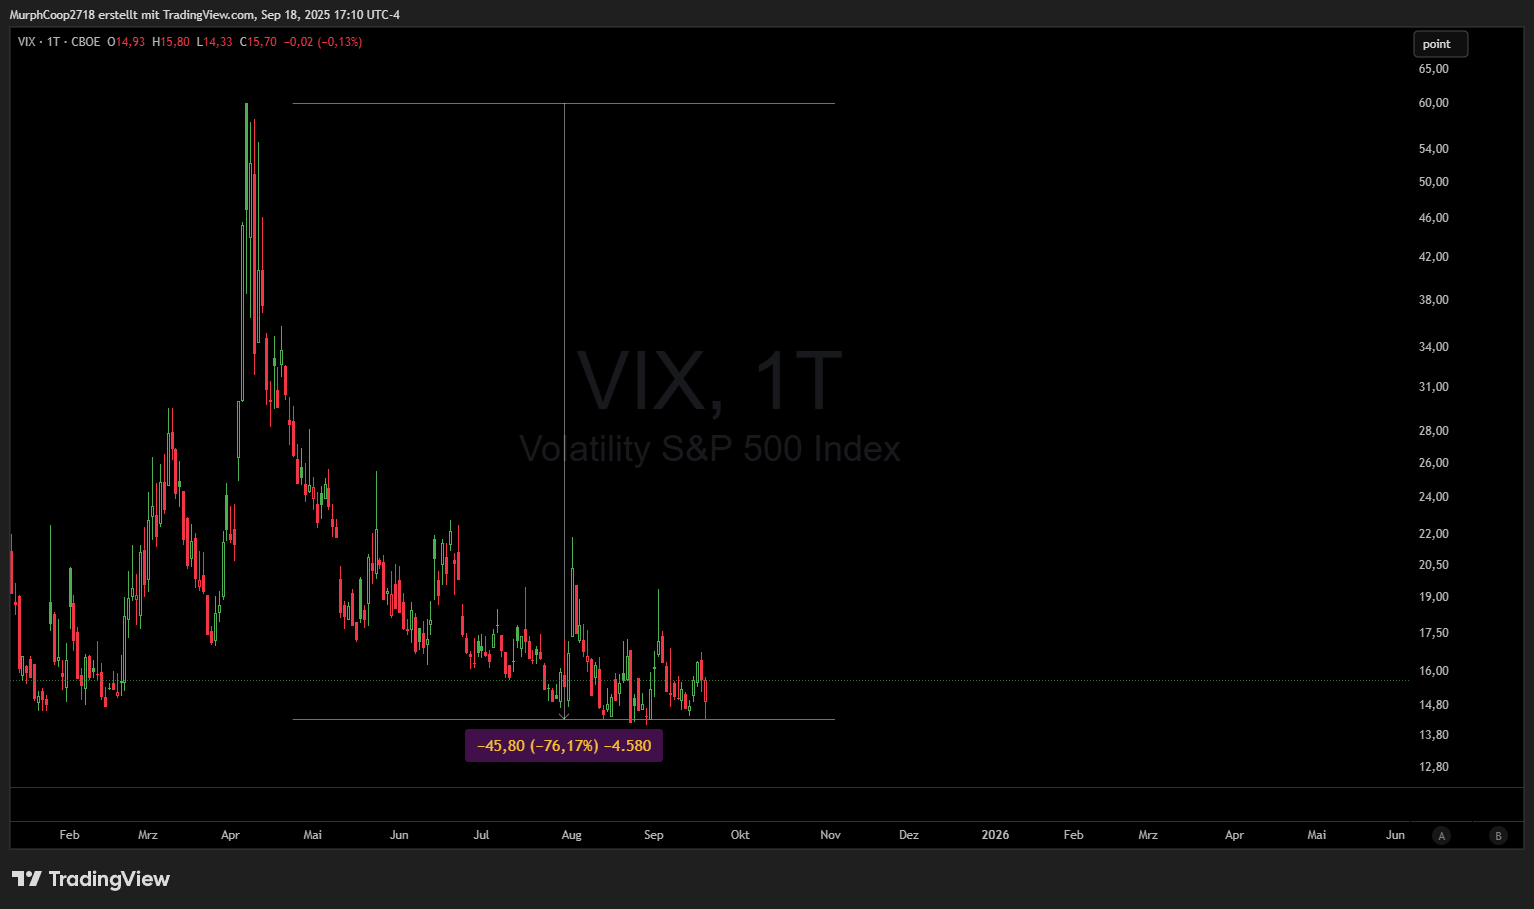
The short vol trade is a very crowded trade, bidding up gamma into this expiration.
CTAs and Vol Controls and any funds that rely on risk parity, increased their exposure mechanically on this rally, as volatility rangebounded with a slight negative drift.
However, the agressive fashion of this vol suppression is crucial, because it made these funds near to their 3-yrs average. And this is a huge positional imbalance, because if volatility catches up towards 13.59% (margin of error is 14.13%), the unwind would be asymmetrical as well, while upside is getting exhausted already, from structural flows perspective.
Running codes, CTAs won’t buy into any 1-2% rallies, but if the SPX falls by 1.5 - 2% they will start to decrease the weight of their allocations, slowly. Especially in NDX, that has the leading weight in this momentum. If NDX falls by only 2.15 - 2.5%, CTAs will be triggered to sell. But anyway, in tech they already reached their max allocation, so they decrease the weight anyway.
The momentum is overly concentrated into 0DTE flows and AI momentum, especially after August, accumulating concentrated and excess leverage.
So, the disbalance is not emerging directly from the nature of the market momentum, but from the momentum of the volatility reversion and the positioning it generated.
Even a small spike that vomma “cannot handle” (because vomma has a net inverse relationship with volatility), could trigger a violent drawdown.
I give levels below…
What is the story that the market wants to tell us?
Market cannot always be frontrunned. During the past months, all I could do is to meassure the risk, derive trigger levels and adjust my longer-term portfolio strategy. The April drawdown was clear as sun, after I decoded what was the meaning behind the February slow selloff.
Now, all what we are seeing is that the market is agressively held for any price, pushed further and further up, hunting short squeeze triggers of funds, agressive vol supply, and so on… on what? On the narrative of Fed cut that would unlock MMF money to support growth and to manage debt burden. The admin must have built a goldilocks narrative around this economy in order to mask the obvious stagflation and future inflation risk. (Debt burden is way more dangerous.)
The story behind the February-April selloff was to bleed-out opponents from the tech sector and to provide discount prices for the Middle-Eastern investors and Trump’s circle.
The market is planned to be reset on a Web3 basis into 2028/30 latest, and until then it will be accelerated, and inflation will be pushed up. I heard from higher government circles and Middle-Eastern investment fund circles that they all plan to trigger a crisis around that period in order to reallocate money into the new economic system… if everything goes along the plan between the USA-RUS and Middle-East, without EU intercepting it. I already elaborated on this in my AI-Bubble post.
Okay, but this is the longer-term picture, painting us a prolonged bull market on tech, inflation, gold and yields…
But what about now? Who is interested to agressively hold the market up with hightened risk, elevated spot/vol beta, high leverage and very asymmetric positioning? Because it all looks too… direct…
Well, I kept emphatizing since April, that this market is not investor’s market but trader’s market. Investors have no confidence on this leg up, they slowly derisking. The April sell-off was also mostly caused by them (weighing machine).
All the buy-the-dip flow was speculative buying flow, simply to generate extra money on this leg-up, but also keeping the risk high after some point (the first 80%+ risk signal appeared in July for me). And because of the risk growing, most funds simply scaling out of those positions, that the insiders can accumulate slowly, while they generate enough money for a buyback lower later.
1) funding markets gapping (SOFR > IORB for days, heavy SRF usage),
2) UST market depth collapsing / big bid-ask,
3) primary credit issuance shutting,
4) systematic-strategy de-lever triggers (CTA/vol-control) and 0DTE flows amplifying intraday moves,
5) broad de-risking in flows
6) Buyback at discount, gaining more power in those sectors
This is the scheme.
Only thing needed is a trigger.
Trump has deals to announce slowly, and AI cap-ex boom, to push some more legs higher and to keep any drawdown under check, sentiment-wise.
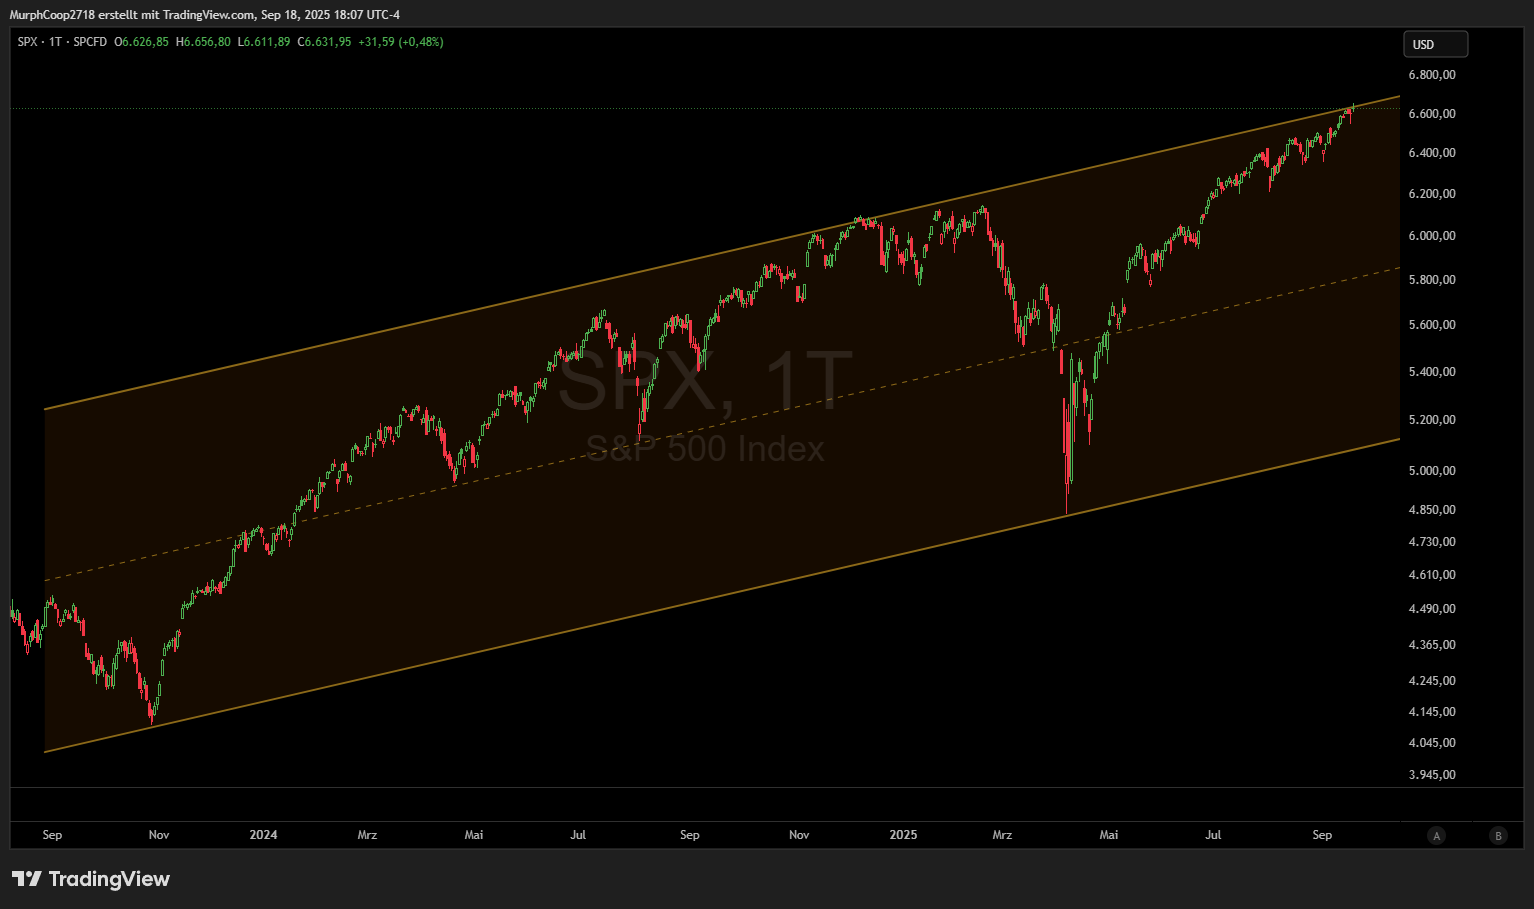
Mark this trend line, as it is something that matters pretty much:
PCE on Sept 26, CPI on Oct 15, or further growing unexpected weakness in labor markets all can be triggers for example for a 6-10% pullback to take back the “Fed cut - hype” returns.
As the economic management is already known, it would be my very solid and confident buy the dip move for the next 3-5 years.
More details (Gold, Bitcoin, SPX) in this post:
