

I’m gonna show you something interesting in this post. Here, I coded the skew for SPX into 18th of February:
In 3D, it looks like this:
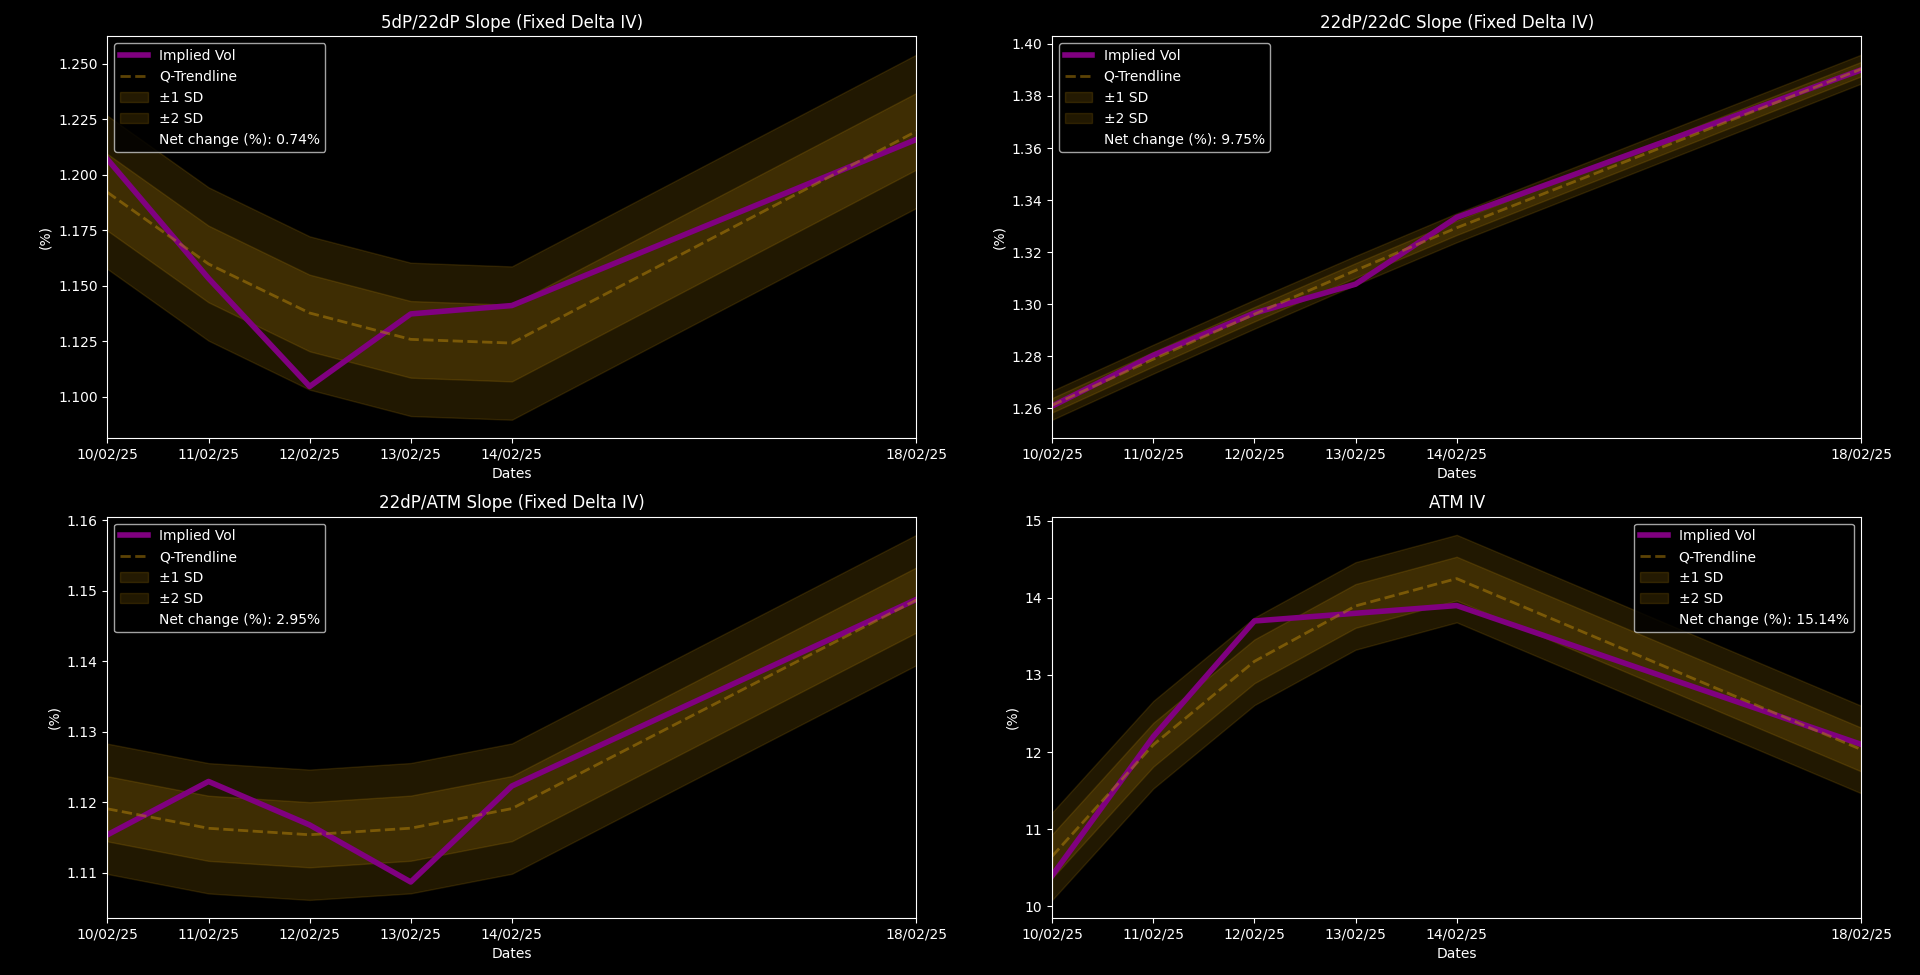
In the middle (green line) you can see the current ATM strike IV change on the next week, same curve that you can see on the forth chart above.
The left side of the skew is the OTM put territory. The farther we go to the left, the less delta OTM put IVs we find.
On the right side, it is the OTM calls territory. The farther we go out of moneyness to the right side, the more OTM call IVs we find.
As not everything can be observed directly by visual, I meassured the slope of the skew using different points, to see, how the IV rate of changes are evolving during the week.
The first chart is the left tail wing, meassuring the slope of the 5d far OTM put and 22d OTM put line segment.
The second chart meassures the same for the 22d put vs 22d call,
and finally the third chart shows the slope of the line segment from 22d put to the middle point (ATM strike).
I added quadratic trendline (with 1 and 2 SDs) to the charts to filter the noise and to make it easire to see the tendency.
And additionally I plotted the change in the curve (initial value vs ending value) in percentage terms to see how the trendline actually move relative to each other.
Now, you can see, that neither of the IV ratios moved as much as the ATM vol.
5dP/22dP goes -5.612% into Friday, 22dP/22dC moves 5.588% and 25dP/ATM elevates 0.618%, while ATM vol increases 29.008% into Friday alone.
Without even looking at the 3D chart, you can tell from these numbers alone that IV surface must form a relatively increasing ‘hill’ around the ATM middlepoint.
What this tells me is that even tho traders hedge the economic data, this activity isn’t that pronunced, and they definitely don’t expect left-tail risk, rather they’re aiming to catch purely the expected volatility spikes around the releases by being long straddle and strangle.
Potentially aiming 6141.13 - 5908.86 SPX range.
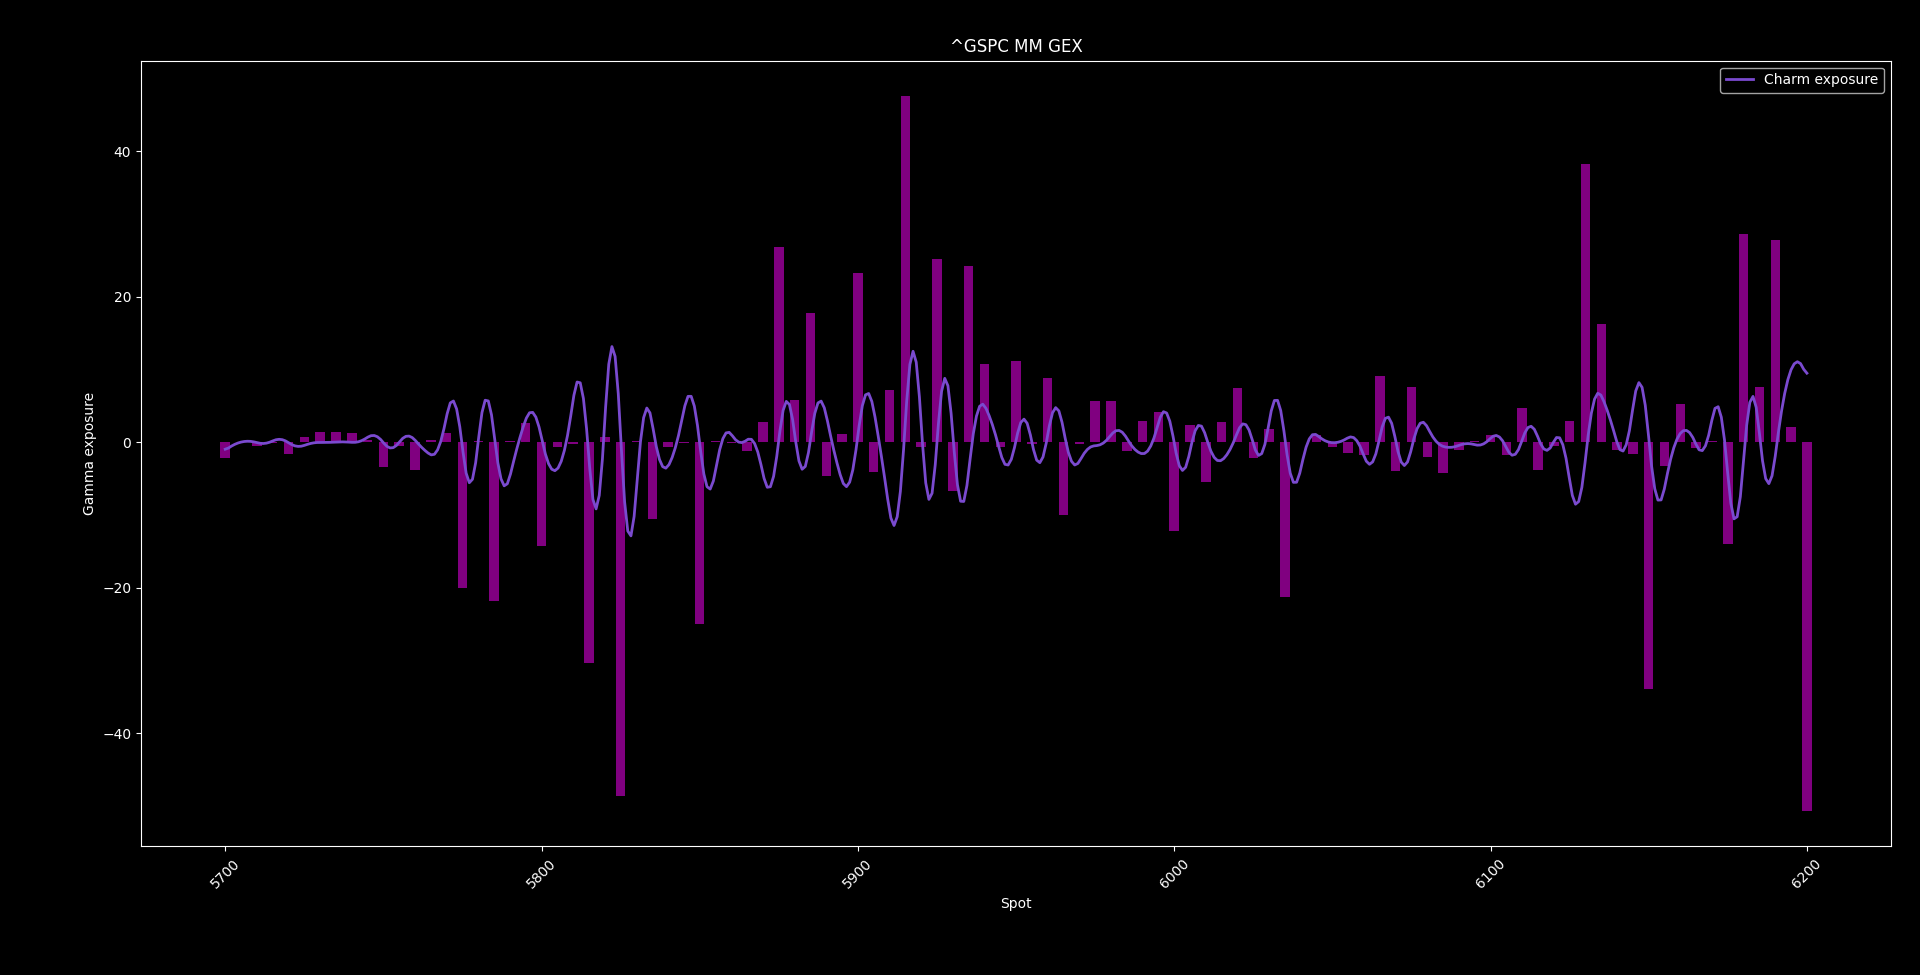
Let’s look at the dealer gamma exposures for Monday:
and Friday:
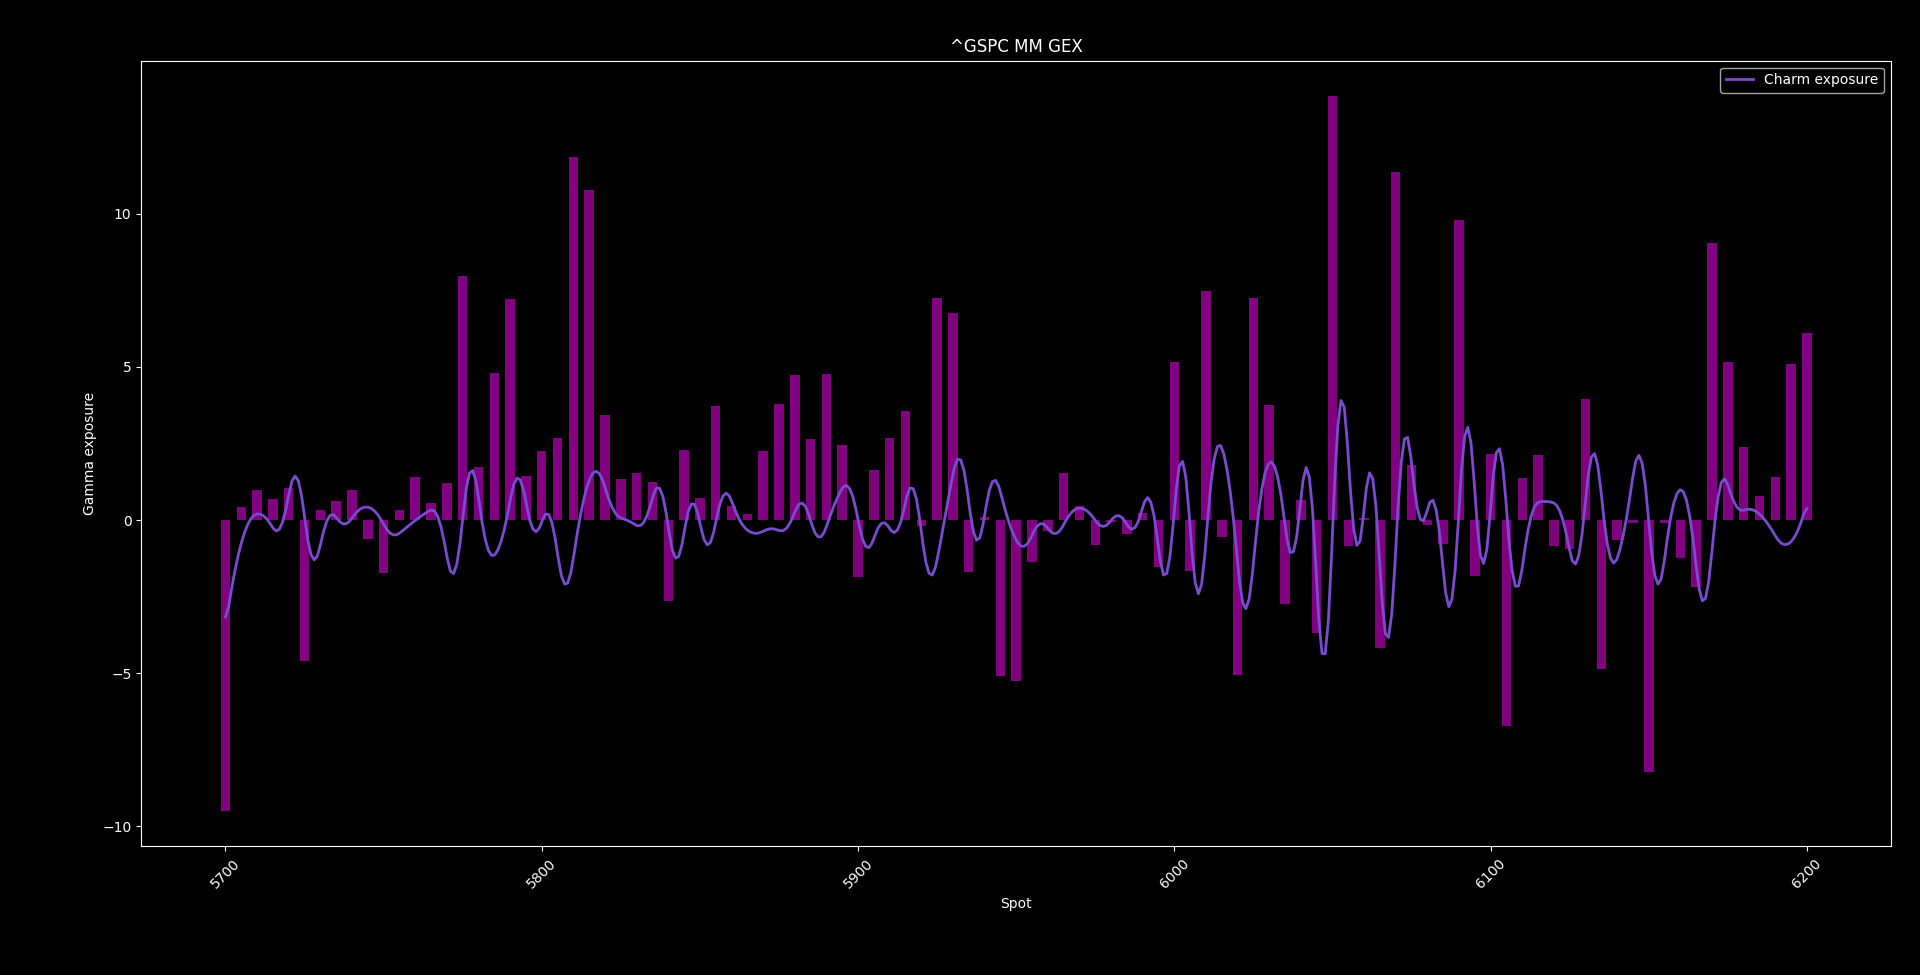
We can clearly see the MM long fly pattern for Monday, and the MM net longer speed for Friday, as it could have been expected from the IV surface.
Now, this positioning (locally increased downside gamma towards 5908) is naturally eating up downside vol on both days.
Bcs the vol surface shows vol trading rather than directional bet, those positions could capitalize only when price reverts from the bottom.
Think about this way: those ATM straddles and strangles are there to catch vol spikes. If the spot starts to fall this would result a spot down/vol down movement, generating losses for those vol speculants, that must be covered. When the spot starts to move up to towards the center of the fly, vol can catch up generating some gains, until reaching the center of the fly, then again starts to dump vol again.
However, look at this:
this is VIX vol surface. Showing us the hidden vomma selling I warned last week.
If vomma keeps being sold, those vol trades vomma decay will become more pronunced if vol catches up, forcing traders to cover more against their position pushing the price further up.
My conclusion is that, there is more flows expected to push the price up than down, but as you can see I expect a retest, before they start to cover during the week.
My guess is that this is the reason why we see negative changes in the tail hedges, bcs they expect vol up with a wide rangbounding momentum rather than left-tail risk, and they don’t want further losses from those put decays.
This makes me maintain bullish bias, but I personally still won’t take any longer-term options position (until March OpEx), bcs I expect high risk (wide, volatile momentums).
At the end, let’s look what GJR-GARCH tells for us about SPX:
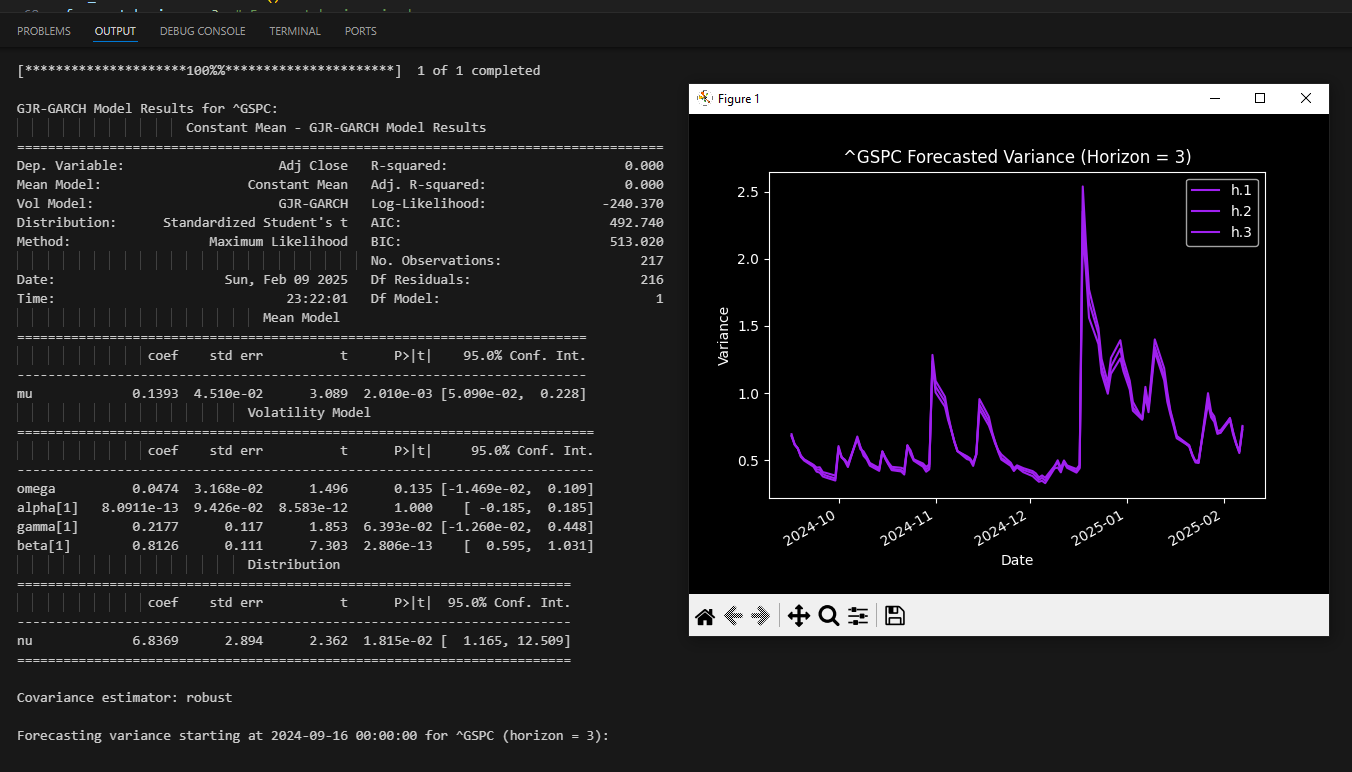
Looking at SPX, the ARCH Term (α ≈ 8.09e-13) says that a shock (whether positive or negative) has almost no immediate impact on the conditional variance. The “leverage effect” (γ = 0.2177) tells us that the extra effect from negative shocks is present but not very large (p‑value of roughly ~6.4%).
I see intraday trading edge more than swing on the call side, but one msut wait for the downside reversions. I go day by day.
Watch carefully the daily “margin of error” range on my provided indicator. SPX must close in this range (if the mean reversion continouse with the rangebound), and close above the daily mean to go further up into Feb OpEx.
I expect violent days but overall trend up.
Amazing work,Thank you ,for me it is quite difficult to understand fully but I am trying my best .
Alma, thanks for this... Once again, this is brilliant insight... There is a lot more to you than meets the eye.