


July Monthly Outlook, Vol of vol supply, Momentum - Equilibrium + Weekly post (07-11/July)
Momentum, Market Equilibrium, Bias, July positioning, Vol dynamics, Weekly expected dynamics, My trading strat
Bearmarket odds have decreased drastically for now, even tho the risk is still not 0%. Note, that August - Sept window is still a pivot, but probability is lower. The reason is not the momentum but strictly the sentiment, because we can see that the market is aggressively held-up, and very much likely that it will remain so until the problems get solved even only on paper. Then the market will rebalance itself just like as it did after 2021.
The reason for that is that the market is very vulnerable and both the economic growth and investor sentiment is dancing on the edge of the cliff. And like that, any major weakness would cause big problems.
Look at SPX recovery after the COVID-crash:

There were five pullbacks that where higher than 6% on the way up, cooling off the volatility by “waiting for the liquidity left behind”, and to build a stable structure after it took back the losses by two 8-10% corrections, before started to rally. The Fed was there with QE, liquidity was stimulated.
Now, look at this rebound:

We only got one 6% pullback after the drawdown, but later on the way up, it didn’t even performed a 3.84% pullback that would have been at least in ratio with COVID momentum. This is a different, and very aggressive regime, especially if you consider that the Fed is not fully behind this move.
Using simple technical meassurements, a ~6360 blowoff top is likely before, the SPX sees a major 6-10% pullback (both offer nice buying opportunity), and coincidencing with two very important liquidity zones.
I’ll tell you, why they are important, and how can this scenario play out, and what the market expects about it. But first, I need to write a bit about the mean reversion theory from a perspective to explain why your eyes can cheat you when you look at the chart…
MARKET EQUILIBRIUM
If you have read my Educational Posts, I wrote more posts about market theories and anomalies. This is key for both analysts and traders to understand.
The market is always about to find equilibrium, but it always creates disbalances. First there is the growth, because the economy is growing, the performance is growing, the prices are growing, market is growing. But then there is the momentum effect, because of the speculative trades, leverage and the reinvestment of the leverage to create more leverage, and also because of the general sentiment that overvalues any directions. This builds a disbalance in the returns. Momentum effect is basically “crowding up” the right-tail or the left-tail constantly, creating a reflexive effect to realize it.
And note, that historical skewness of SPX is also oscillating around its equilibrium net negative estimation!
…it keeps re-centering itself around its longer-term mean that is net negative holding an equilibrium skew bias, as you can see below:

(You can observe how the shorter-term averages are also oscillating around the longer-term averages.)
However, the market will eventually rebalance these accumulated disbalances. But not in a way that many people thinks! Because price action has two dimension: the price level axis (y-axis, vertical), and time axis (x-axis, horizontal). And just like the two sides of a right-angle, if the horizontal leg gets longer, while the vertical leg keeps its height, the slope of the hypotenuse will be lower, than if the horizontal leg would be shorter. The slopeness is mathematically measured by the vertical leg-to-horizontal leg ratio, that is the same as Newton’s formula for velocity, where horizontal axis represents the time and the vertical axis represents the displacement. And in terms of price actions, velocity is indirectly refers to volatility, and as a result it also reflects the level of liquidity (inversely, see the post).
Well, market can functionate only if there is liquidity, so the providers are keep rebalancing it time-to-time, as necessary.
As a result, volatility exhibits strong mean reverting behavior. This behavior is even stronger than what is exhibited by the price actions, that follow rather a positive-drifted special random walk with both momentum and mean reversion behaviors.
However, this liquidity-rebalancing act that keeps the volatility mean reverting, is also reflected in the returns at some point when one scrutinizes its movements.
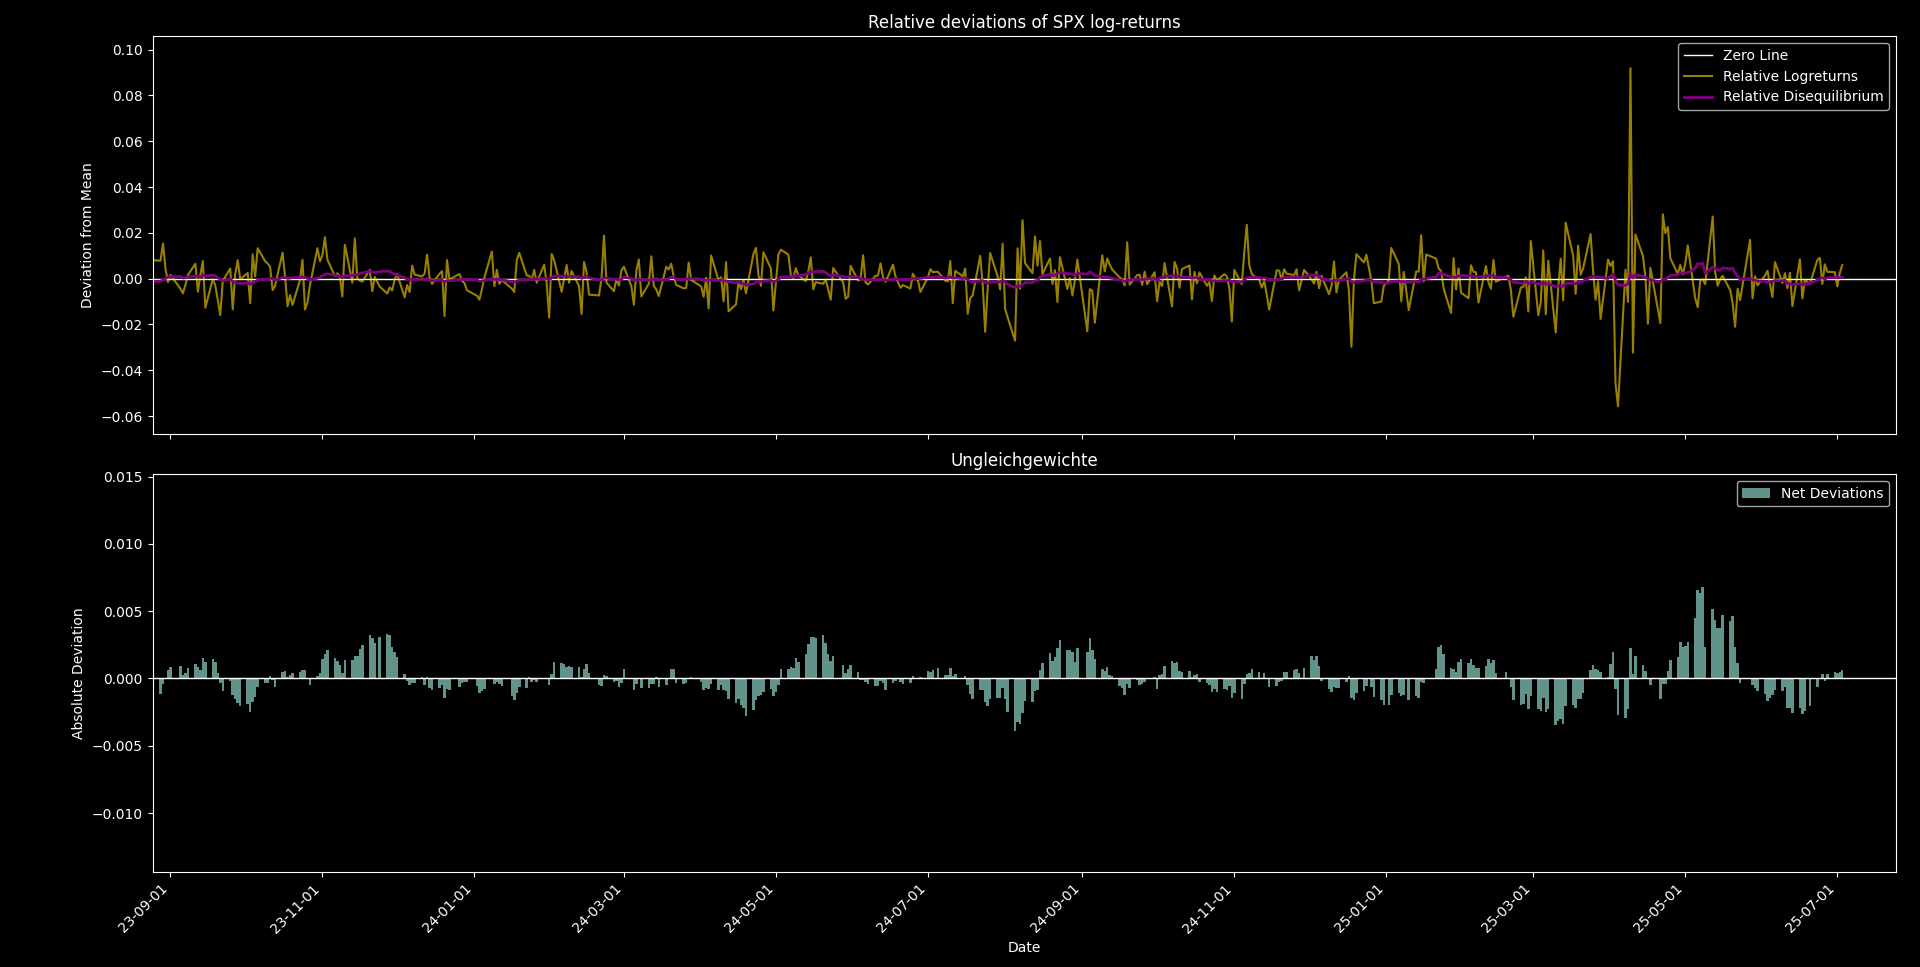
Here you can see the relative logreturns of the SPX. (By relative, I mean that the code compares the individual returns to the average return. Simply because a daily return of 1% has different meanings if the monthly average return is 0.3% or 2.8%) On the cyan colored histogram, you can see the positive-negative imbalances of the SPX returns.
Now let’s look at the relative momentum of the SPX, I coded:

Everywhere where the purple line crossed the horizontal, the momentum found equilibrium. I projected the price levels and dates where these modelled equilibriums occured:

As you can see these are not always coincidenc with market tops and bottoms. Sometimes they do, but in a significant amount of times they don’t.
Why? - Because it is not the price level that rebalances itself (especially because the market is growing), but it is the liquidity!
This is a common trap that many people falsely assume when they meassure a steep trend: it may be steep to your eyes, but liquidity already found equilibrium.
Crucial.
Now, go back to the relative SPX momentum chart (just right above this one).
You see a relatively high positive disbalance. This can rebalance itself down in two ways: a high vol sudden crash (very unlikely), or simply slowing trend in time, that can be 1) choppy, or 2) upward drifting oscillation. It can take weeks until the purple line touches zero, and only after then it can start to accumulate negative disbalances (later in this post, I will tell you the level that would shift the momentum of the purple line).
If you scroll back up to the relative logreturns chart, you will see a similar indications: the returns actually have some negative equilibrium (pretty counter-intuitive, right?) and both seemingly and mathematically (cyclically) seems like going back to the positive territory. (later I’ll tell you the estimated time of the cycle shift).
So the key is, that price action is two dimensional. And so, the equilibrium can be found on both axis.
If we look at the volatility, it definitely overshooted and accumulated some negative equilibrium, but not as much as many would first think:

Let’s look at its momentum:

It still have room to grow. I estimate around 16.88 - 20.73% range currently, where it can grind back up. The exact magnitude would depend if vol of vol remains supplied, because then time would help to find liquidity earlier.
However it could still produce a 5.79 - 7.11% pullback in the next 1.5 - 2 monthly window. The higher end is close to what is technically estimated in average.
The key takeaway here is that liquidity imbalances (volatility over/undersupply) is what moves the market.
News, Fed, ERs, datas, timed announcements are only there to amplify momentums on the short run (quarterly - yearly window). Events generate liquidity and liquidity generates momentum. Momentum produces gains.
On the long-run however the market rebalances its valuation. This is what Benjamin Graham called as the “weighing machine”…
SENTIMENT AND BUFFETT INDICATOR
The bearmarket risk arises from the fact that the April drawdown was caused by investors, not traders, and the positive imbalance and overvaluation is relatively significant in a multi yearly window. As the market is held up aggressively and artificially (including pumping the “voting machine”), even if the recession is bottomed (likely), the market will revaluate itself.
Currently I don’t see that Trump will let it happen. He and the banks, investement funds have every tool to make it growing even on paper until the underlying problems are tempered enough to be revealed.
However, the underlying sentiment based on economic uncertainity is very pessimistic. Junk bond spreads and margin debt are grinding upward, while valuation models show extremely overvalued conditions.
What I think is that bearmarket can be pushed farther in time (like into 2026), but based on cyclical analysis, I see it coming, and my estimation that at the end it will take back the fake pumped stagflationary gains since 2020 March-April.
Like P/E ratio shows dot-com bubble levels, after that a multi-year bearmarket followed. This level was first hit in Dec of 2021. And just right before April, and currently trading at that.
On an interest yields level, market is also overvalued, but it still has some room. (Higher interest rates lowe the profit of the firms, that will lower stock prices.)
If we take sales datas we can meassure the stock price relative to the sales too (cannot be as easly manipulated as earnings). For now stocks are way overpriced relative to their sales too. Above the dot-com bubble era.
The Buffett-indicator takes the ratio of the Total US Market Value to the GDP, that is “probably the best single measure of where valuations stand at any given moment”:
This means that the current value is 209.53%, signaling extreme overvaluation.

The “beauty” of this metric is that if GDP growth slows down, the indicator will naturally rise, meaning that there is a smaller economic base for the same equity value.
Beside these valuation metrics, market breadt, put/call ratio, market momentum and simple sentiment meassures show extreme greed, foreshadowing a pullback.
But the valuation models show that the weighing machine is slowly turns on.
In the short-term, If the market pulls back, as it should to build a stable structure and liquidity zone higher, BTC will also fall. I currently estimate it to 40-60k, but I will cover it later in a separated post. As the economy is planned to be tokenized in the next 5-6 years, I will handle BTC and ETH as an investment from here.
For now, I don’t make longer-term swing trades, even if the momentum points up in the very near-term. I need to see, how equilibrium is built, because momentum doesn’t signals immediate pullback, risk is there and growing (especially if spot up/vol up blow-offtop happens), while revaluation is likely coming in the next yearly windows (or later this year - way less likely but not zero %).
I hedge the downside risk based on my probability estimations, scaling out the short-vol and long delta positions and wait. No need to trade constantly. If I see some nice intraday setup, I jump in for a fast trade.
Now, let’s scrutinize, what the market actually bets on for this window, and I will tell you what the time series analysis told and what probability I got.
Let’s look at what the monthly vanna tells us: