

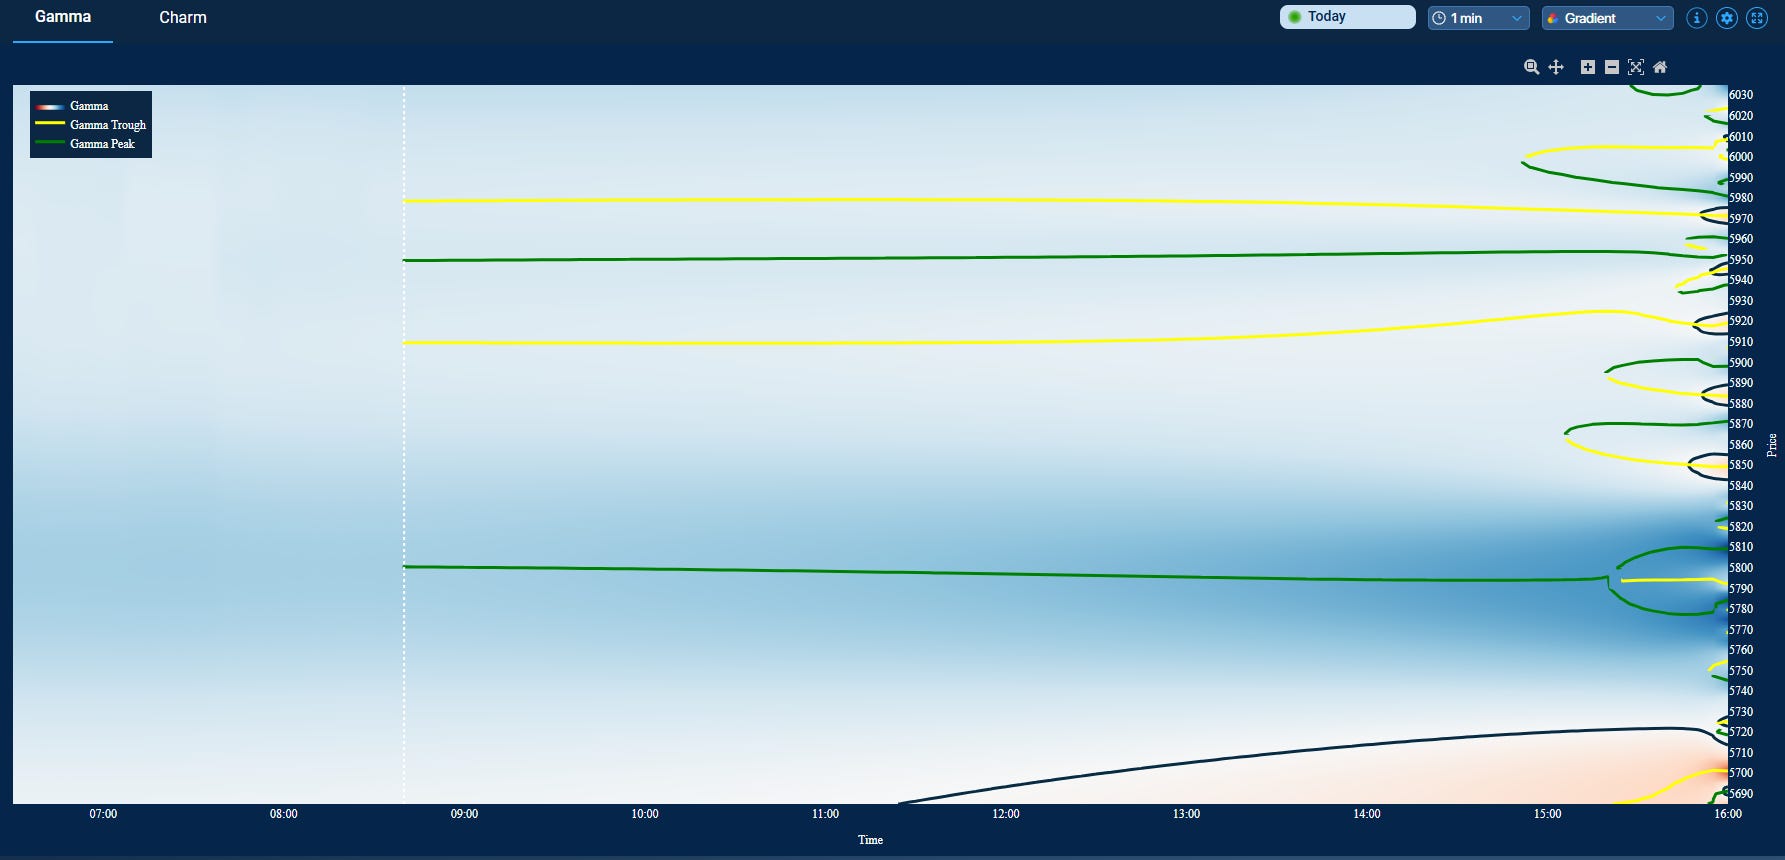
Coded gamma for today expo:
3D chart, my heatmap.
OptionsDepth:
Coding zero vanna at 5914 (positive vanna convexity, vol has to calm down to break above this line), and downside vanna flip at 5795.65, here you should see vol up to break through this line (negative vanna convexity).
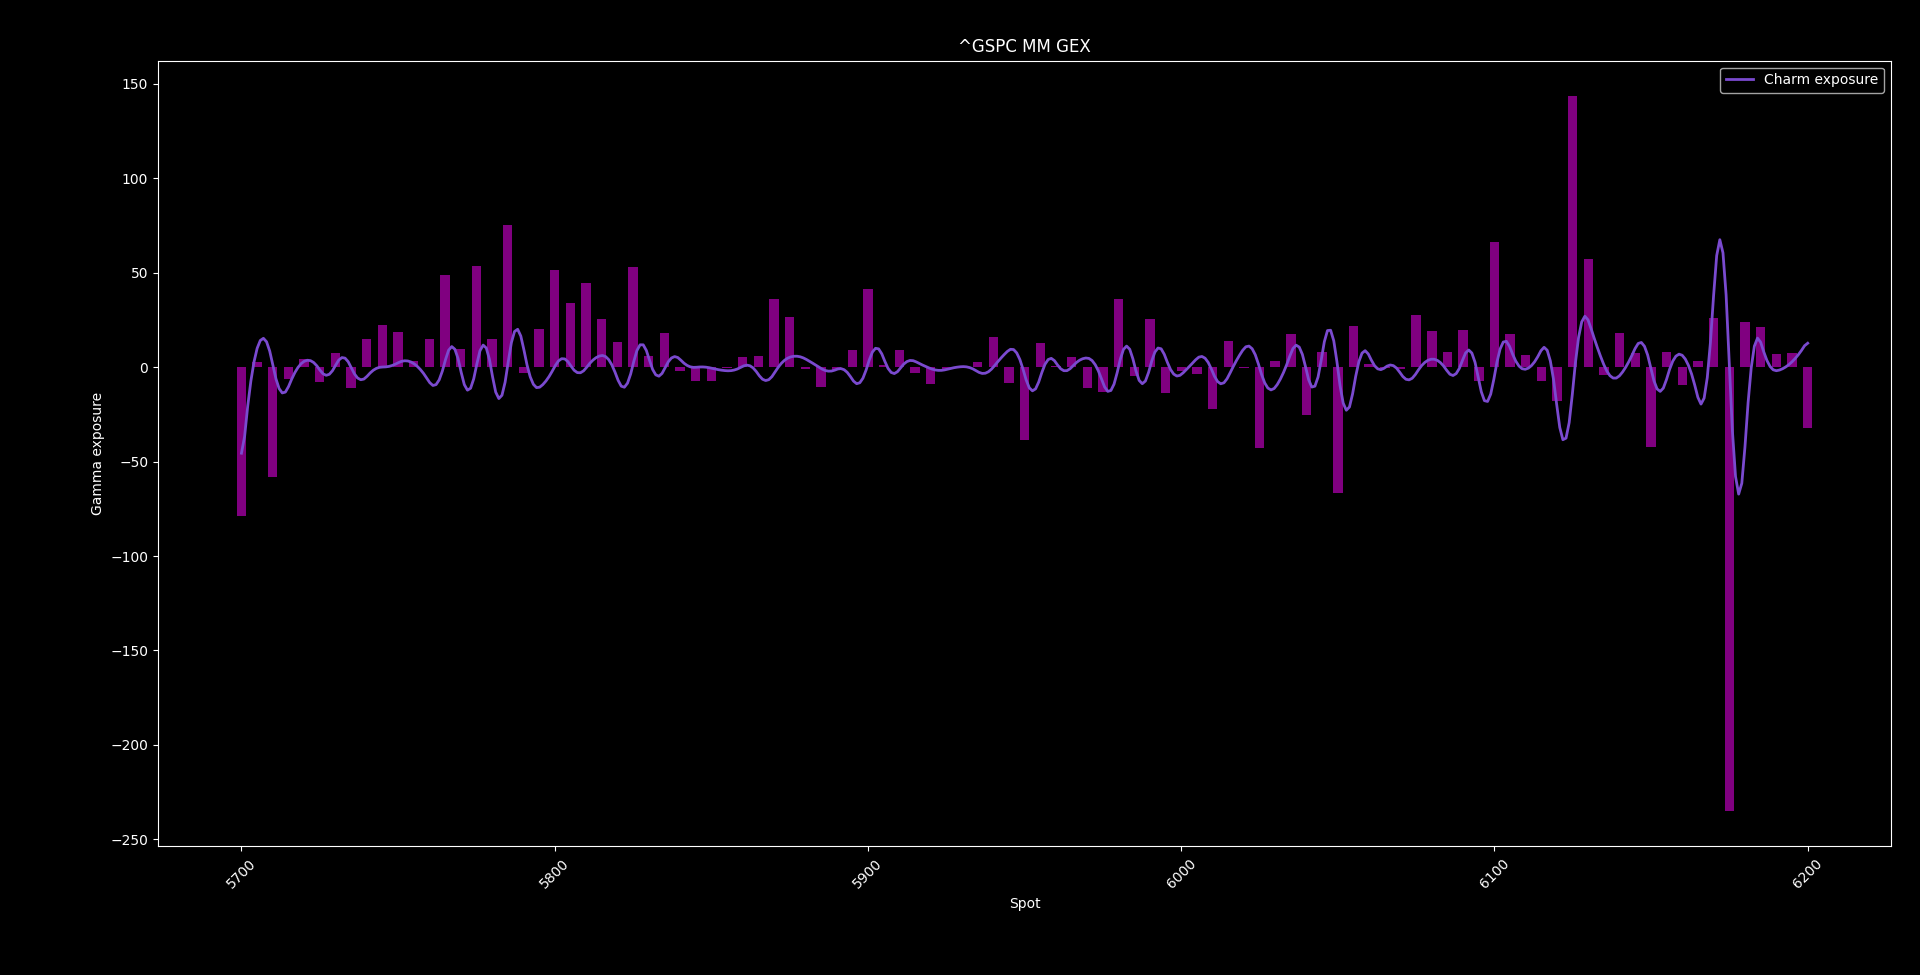
Significant flip points from gamma perspective for intraday trading at 5890 and 5856
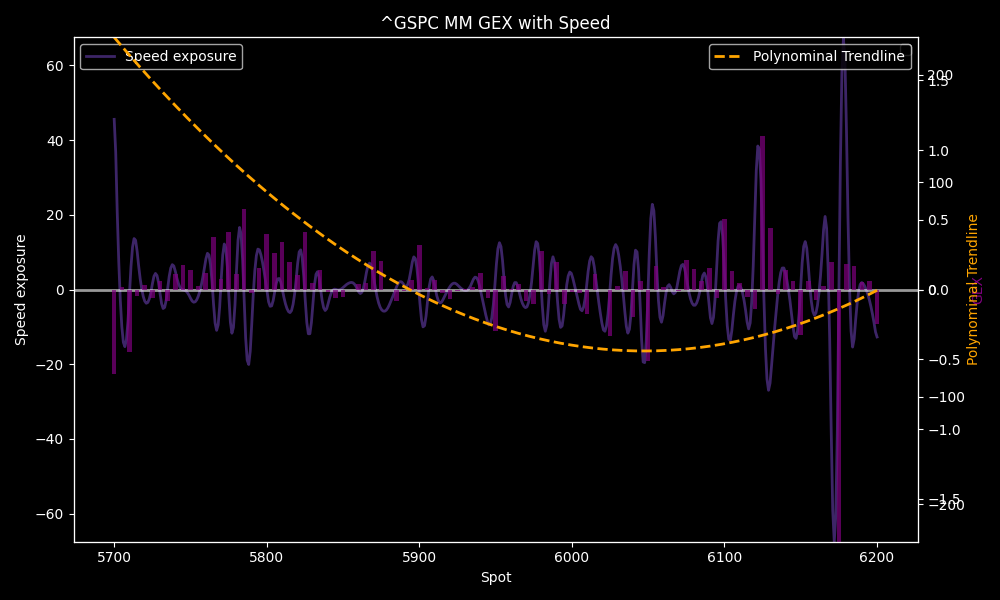
As you can see on the chart, locally we are in a negative speed environment that is mechanically suppressive (as char nor a vol crush aren’t supportive), but still accelerant to the upside towards the vanna flip with increase spot/vol beta, short-term gamma squeeze. I code 5854.77 as the pivot for that.
We also have negative charm convexity = short color, meaning these low gammas will furter decrease into PM, making the profile more steep, adding to vol and suppressive flows into EoD.
MMs have deltas to buyback, we will likely see that in the opening, but as time passes, long charm exposure will increase put deltas and MMs will sell, if spot cannot grind above 5934.48 before PM
From mean reversion perspective, SPX is likely to forming a near-term bottom again:
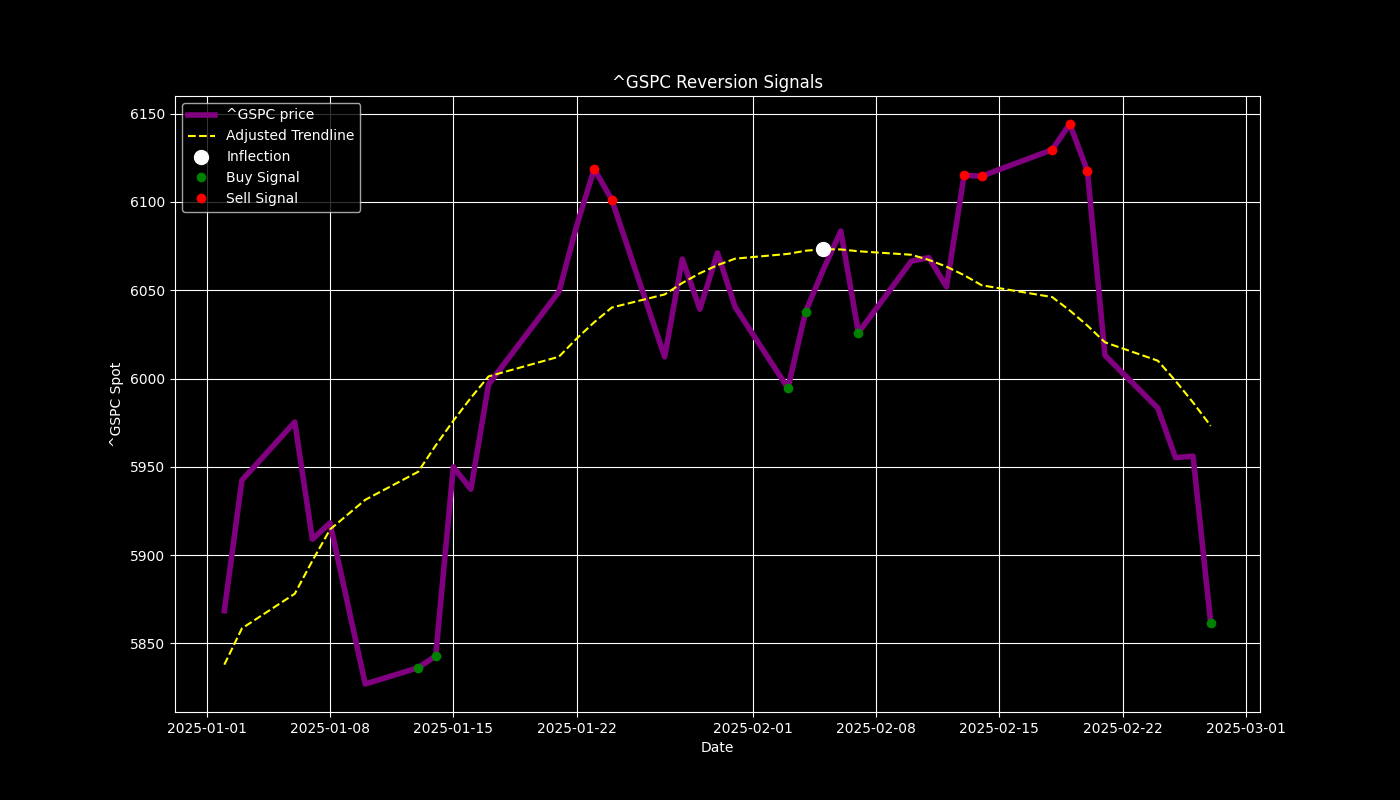
But as long as I don’t see another new white dot, I’m not convinced about the strenght of the move more than a bounce. Code says, SPX should hold above 5953.38 to confirm upward momentum.
“Spot decay”
I spent some time explaining in the chat this week since Sunday, my call about a hedged spot decay, where downside vol cannot really catch up in avg, and the market slowly grinding lower into a supportive March OpEx.
I explained this call in the Tuesday morning post, with link to the chat explaination.
I already saw this kind of pattern in ‘22 and also in ‘23 too. What this means is that
While the net trend points down, there is not enough intraday edge on the puts side bcs the trade is crowded. However the call side edge is better bcs of the underpriced odds. Personally while I still hold my puts I bought at 19th Wednesday close into March expo, I look for intraday call edge reversion trades and not building directional exposure until Q1.
The expo will be covered on Sunday post.
VIX call accumulation
We can see accumulation of VIX call spreads on both April and May expos.
Now, you better know, that in itself it is not very telling, bcs it can be a simply rebalancing activity from some large portfolio. We could see similar like back in jan 17 last year.
What we must do in this situation is to watch for sudden spikes in the prices of near-term VIX calls and SPX far tail puts (e.g. 5-10 deltas), like 1-week or 1-month calls, and also watch the trend if the VIX momentum is sticky at higher sigma lvls or not (my shared SD indicator can help with this), in order to catch actually tail-risk expectations.
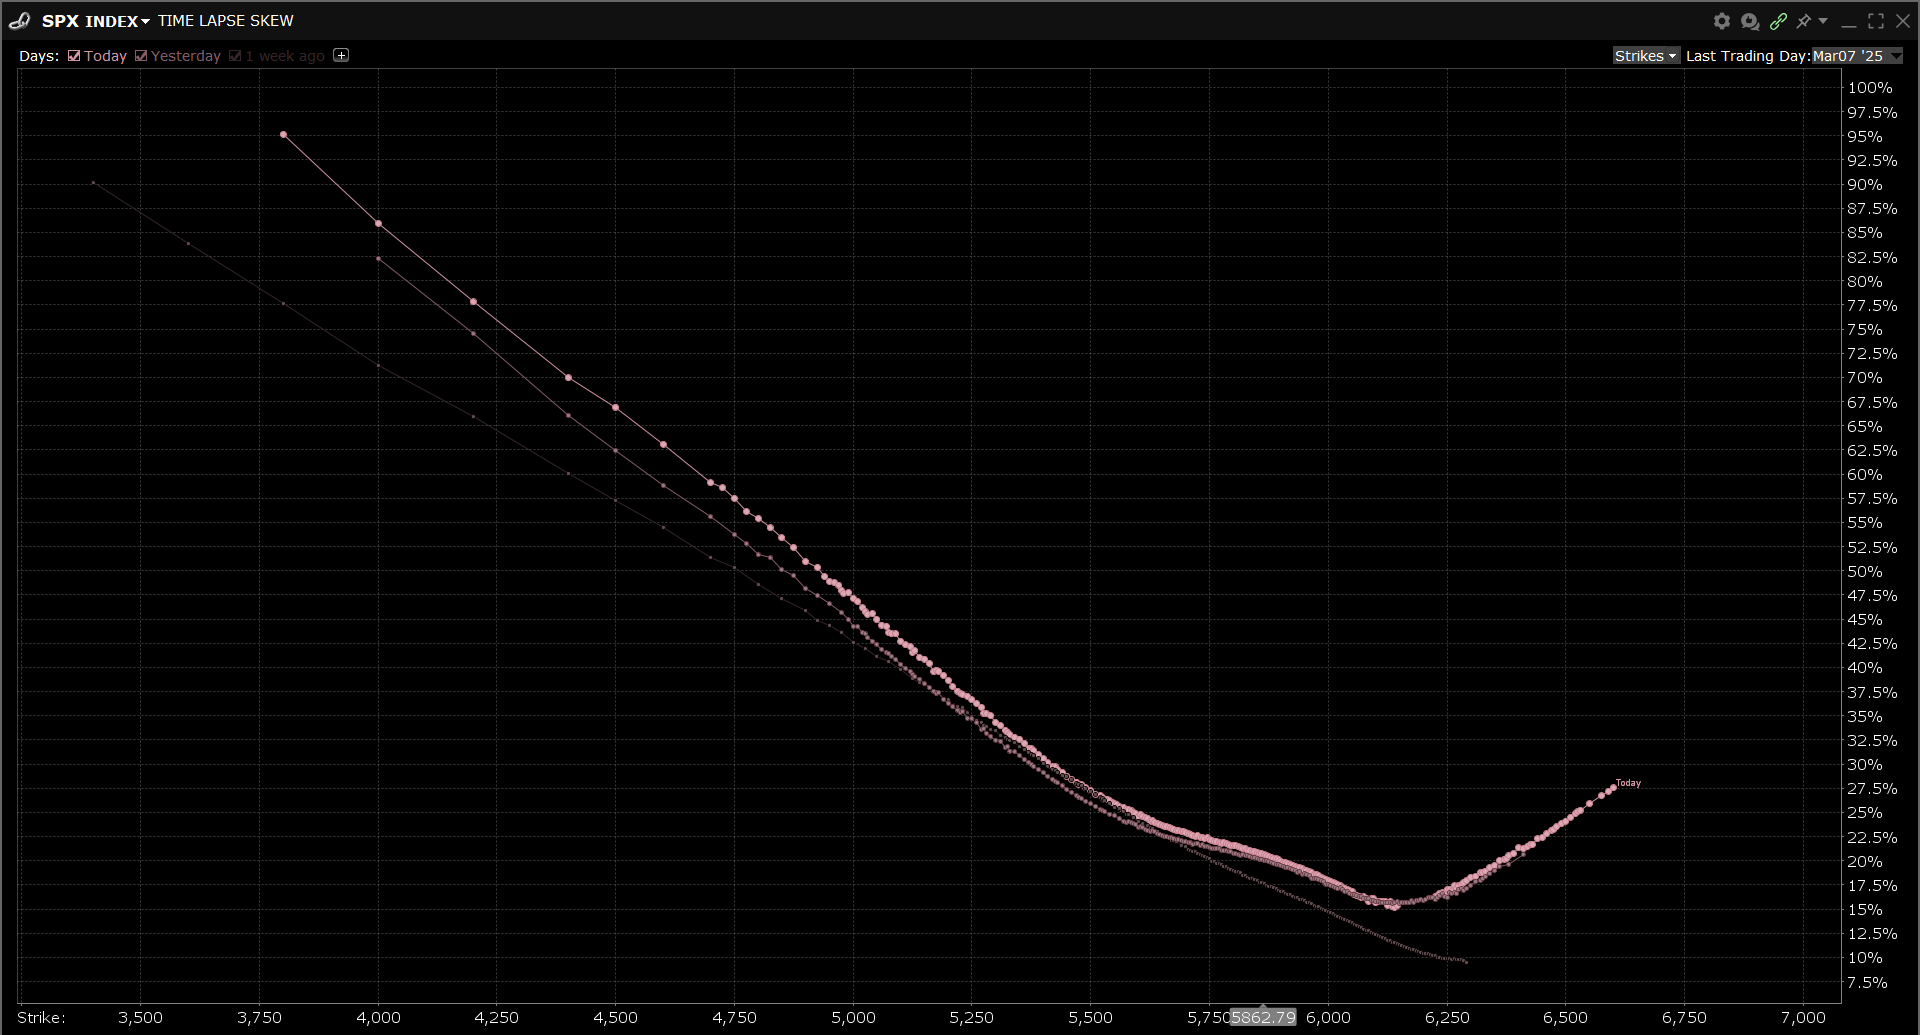
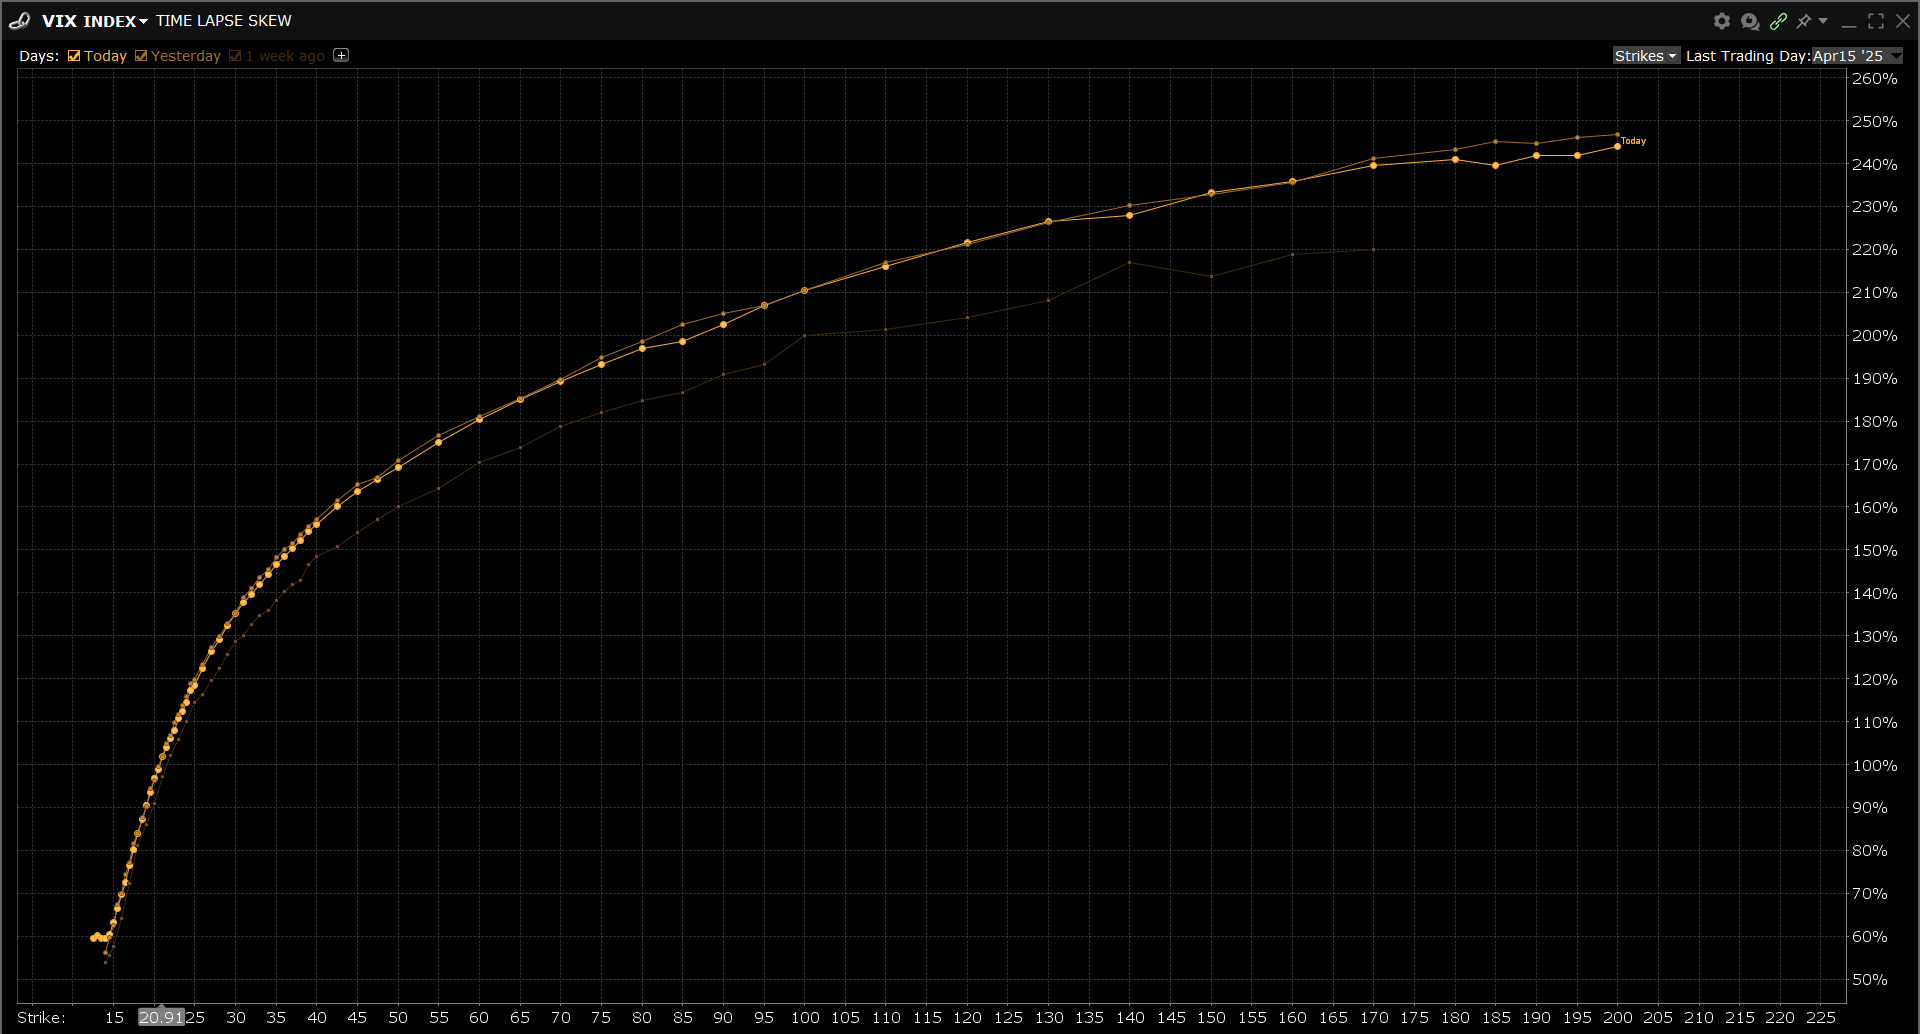
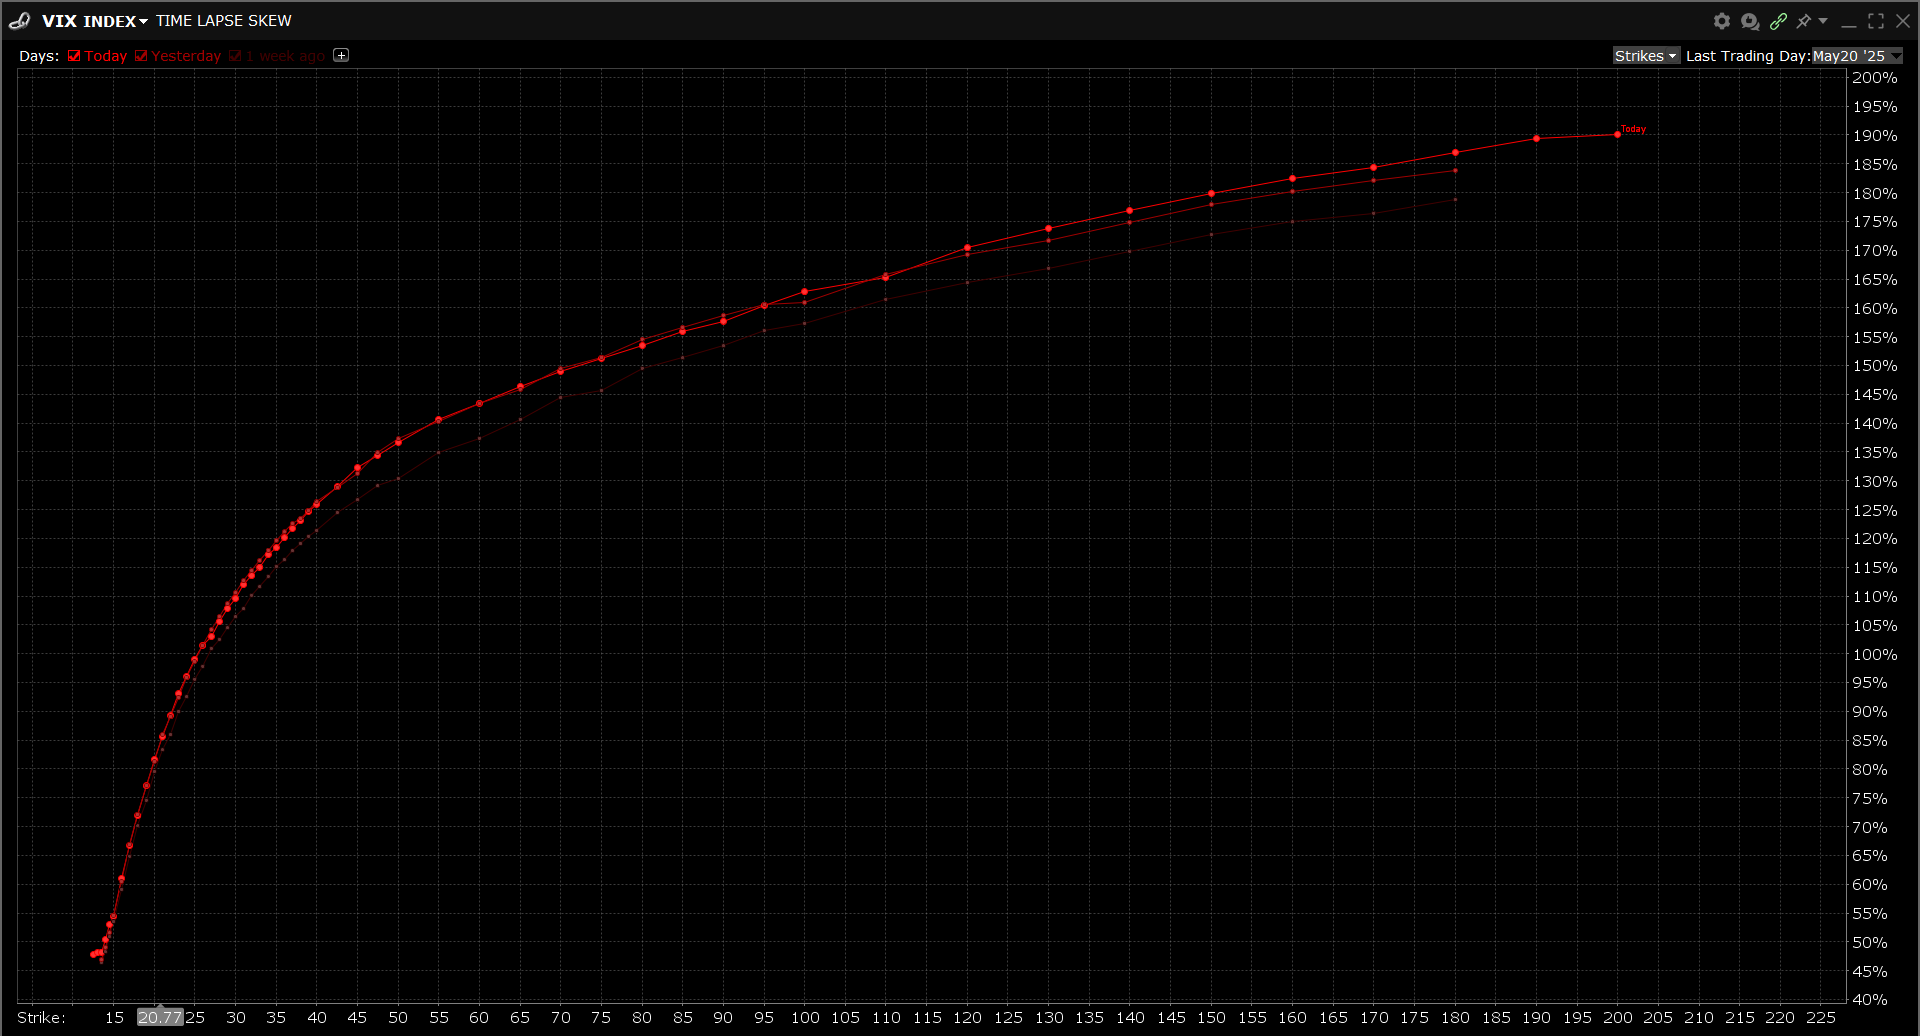
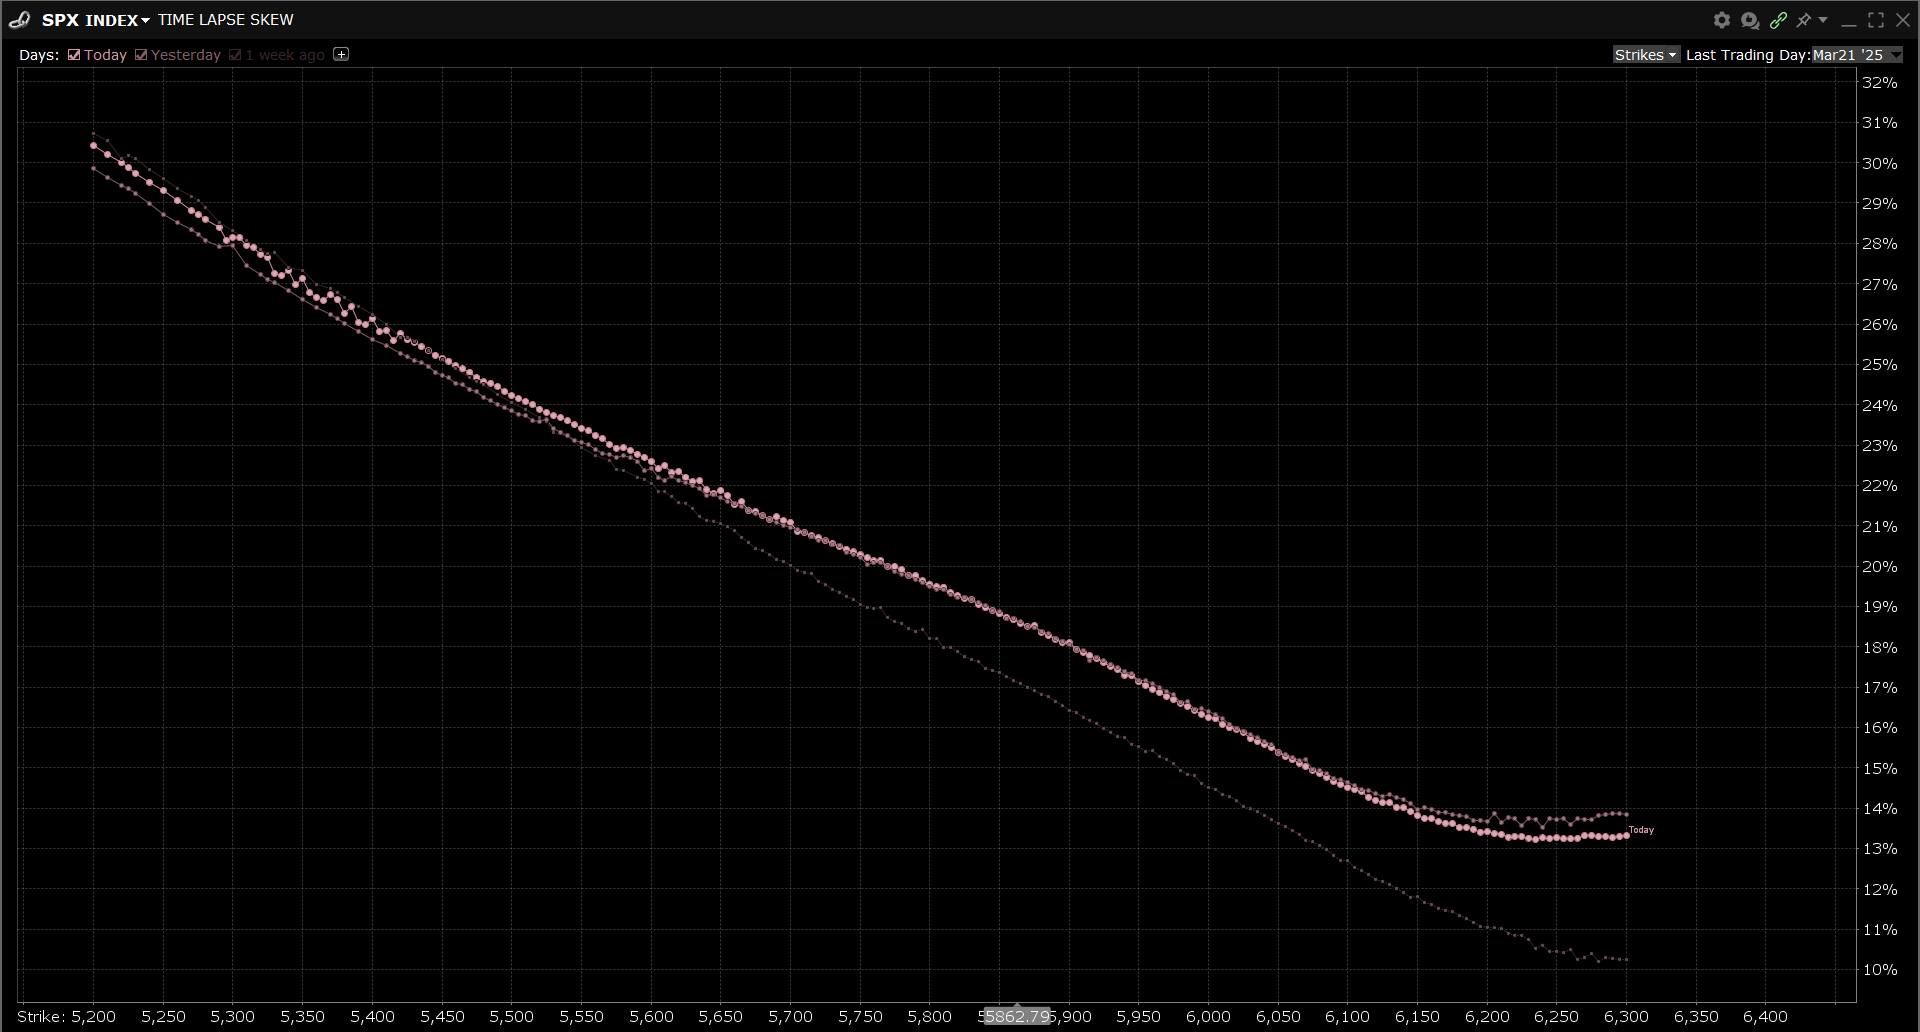
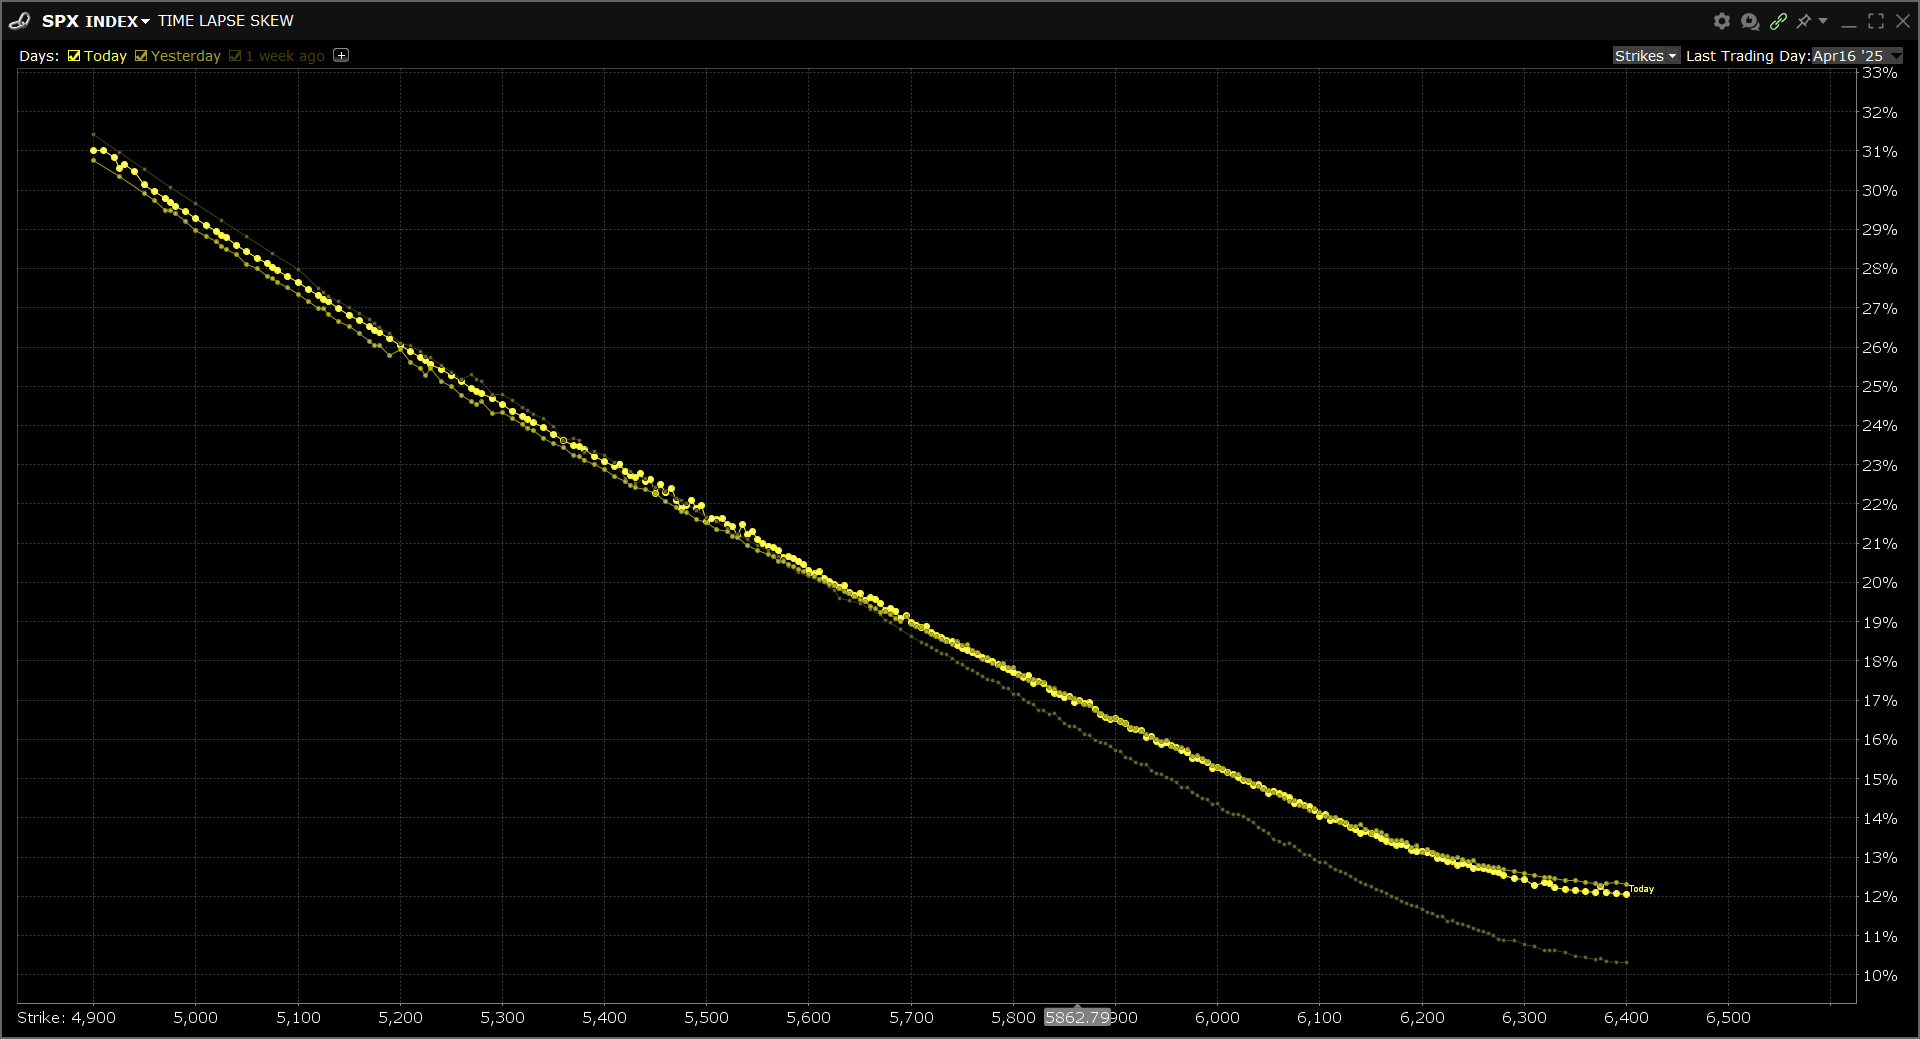
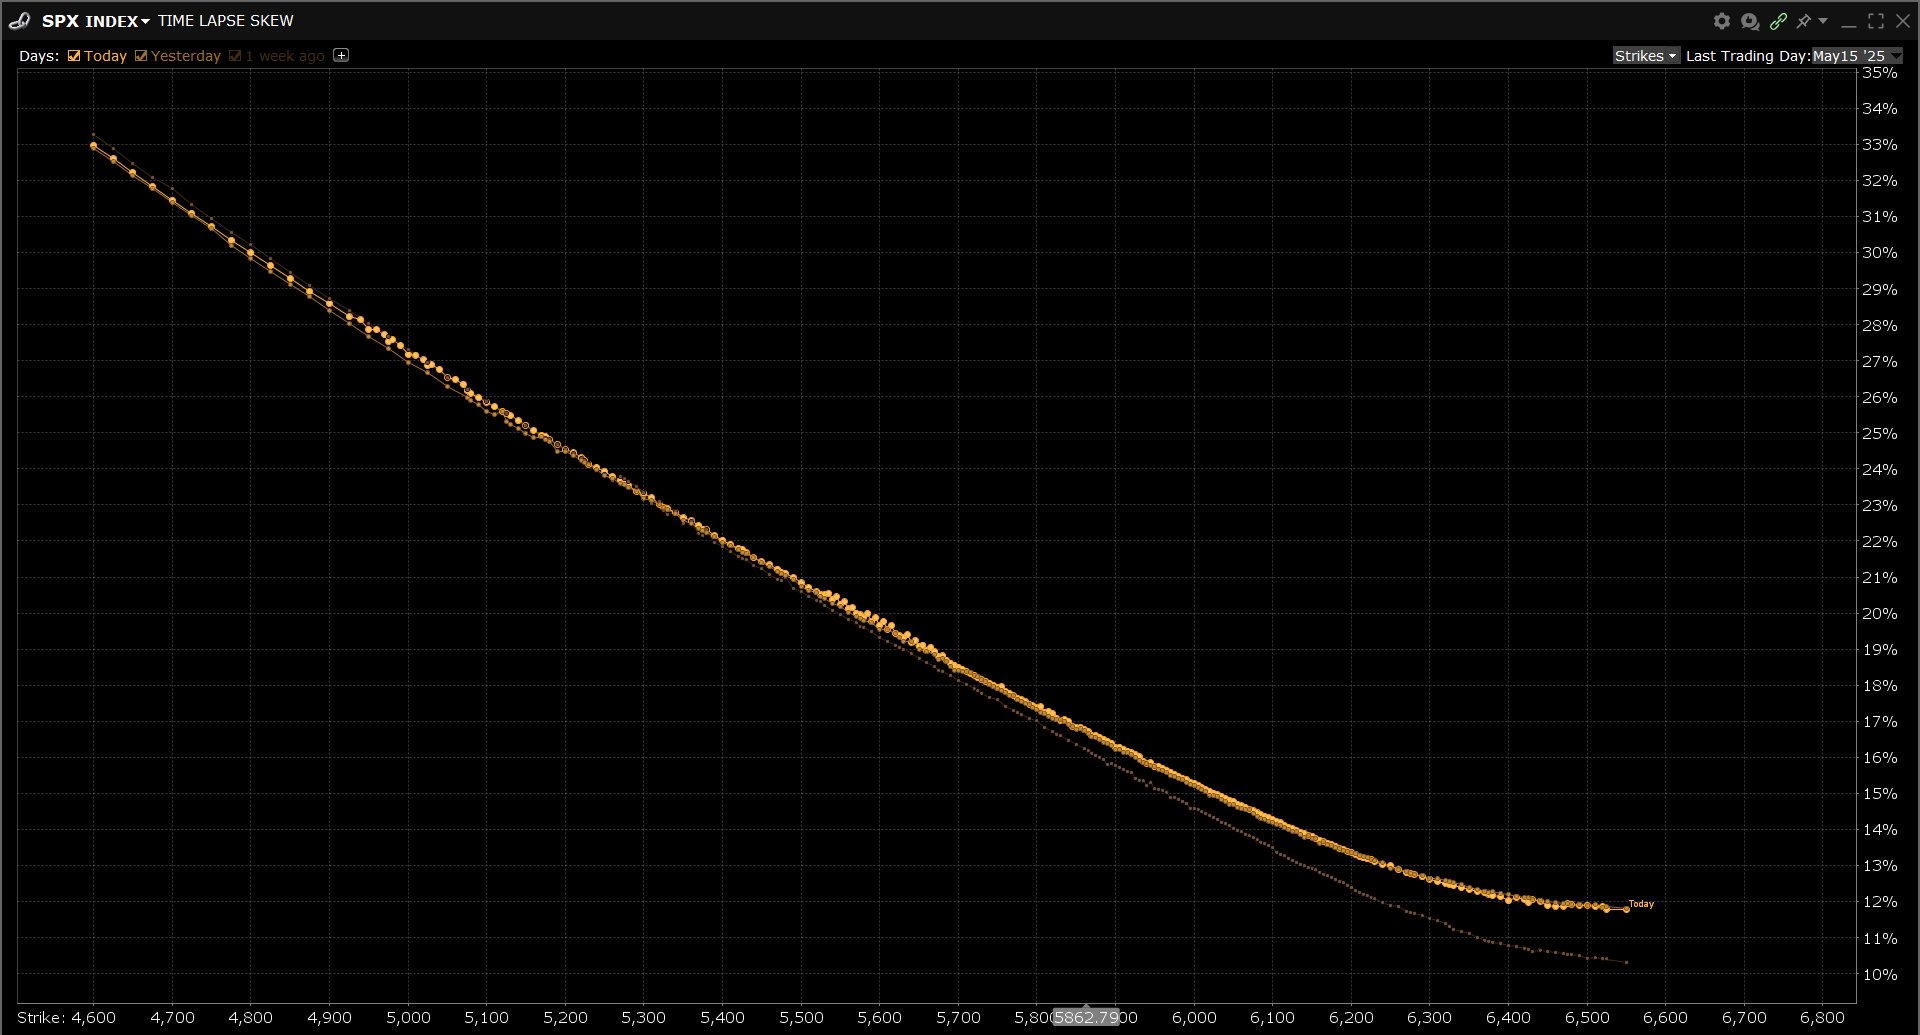
Here you can see the multi-expiry skew for both SPX and VIX into next week, March expo, April and May:
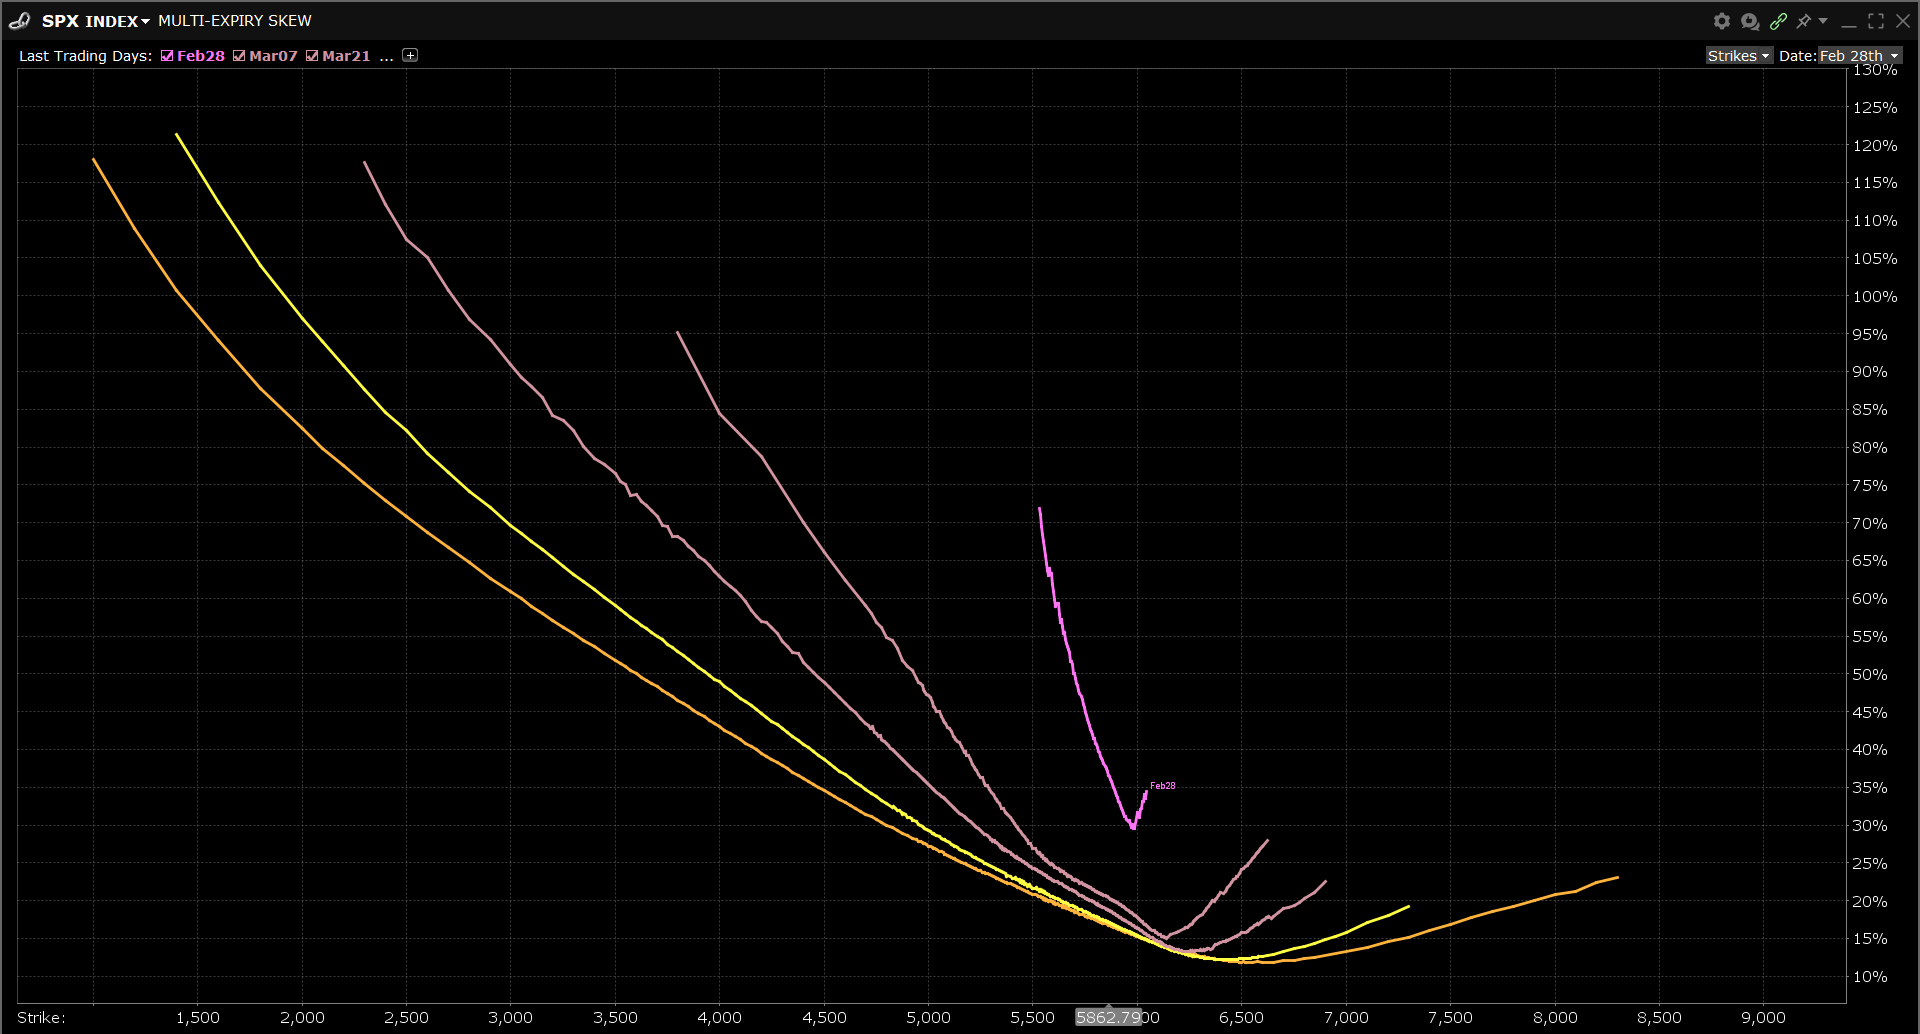
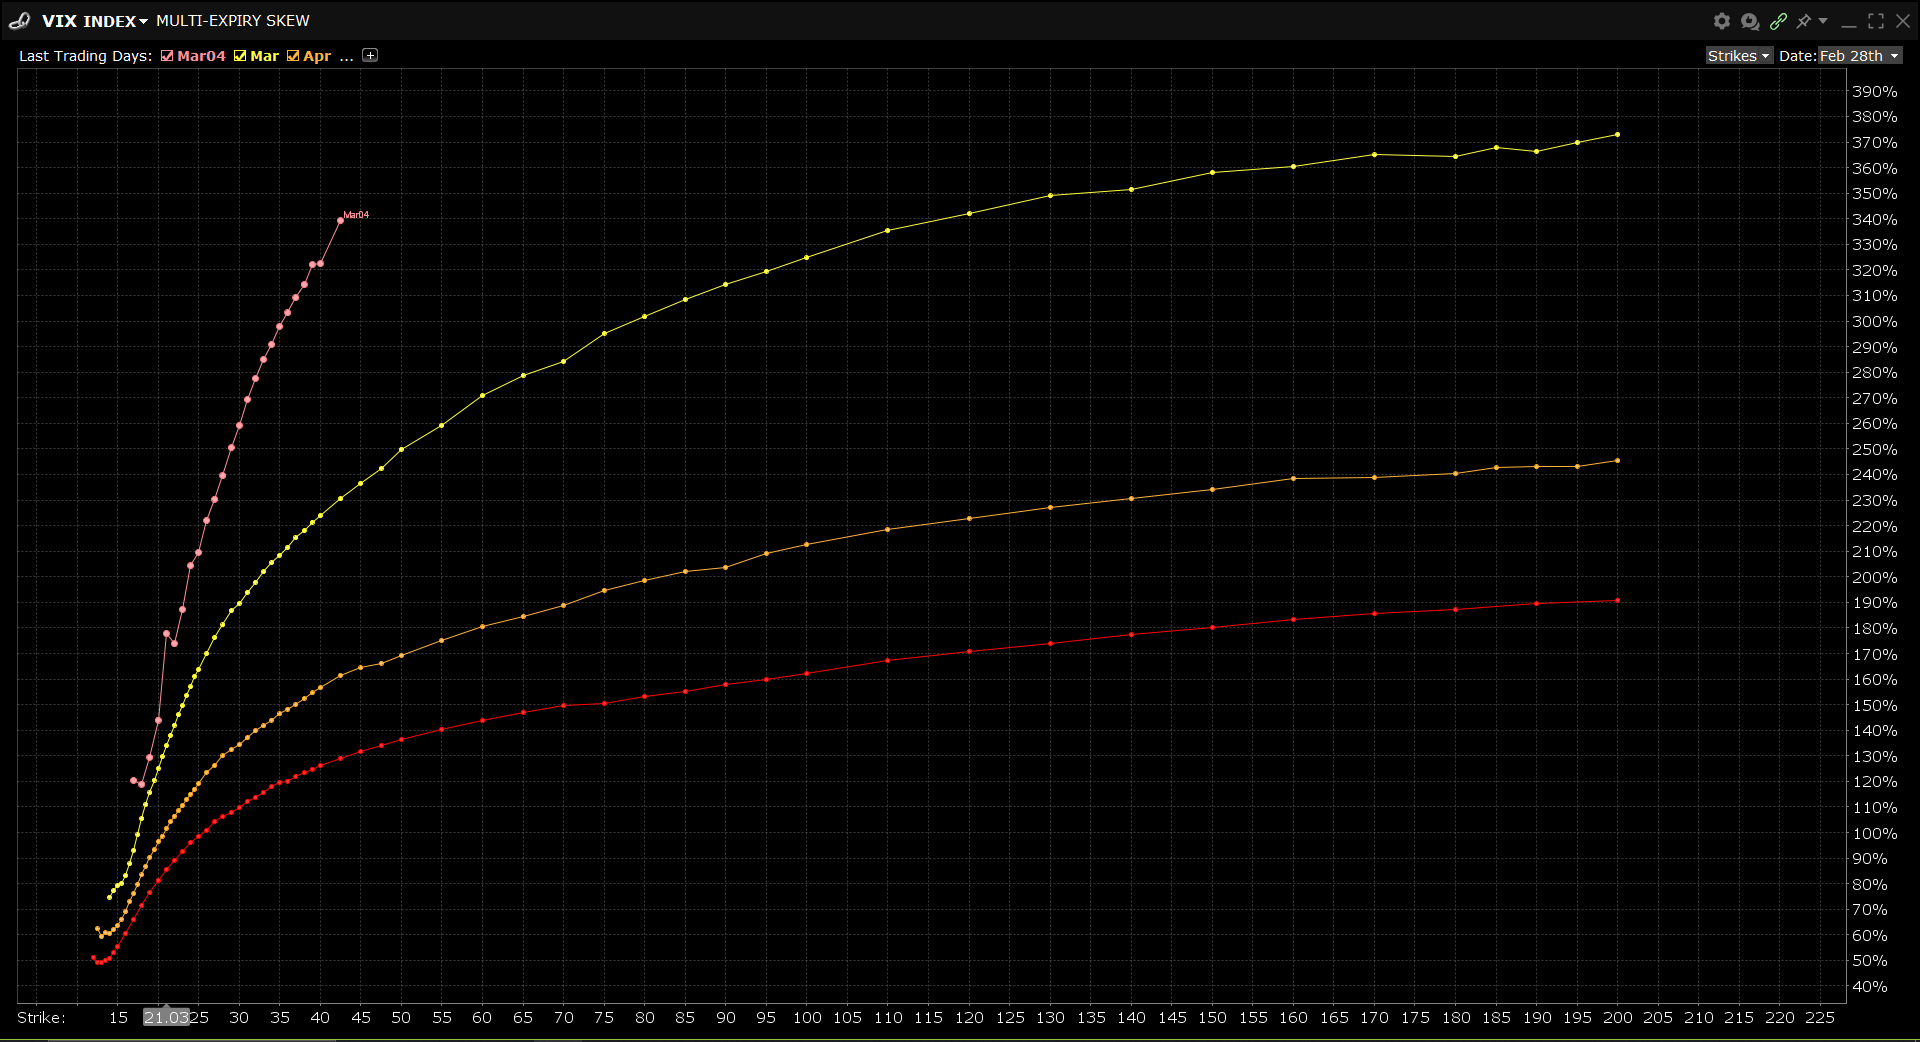
Now, in itself these aren’t quite telling. What we have to look for is the CHANGE in the pricing of these events like from post-NVDA ER, and 1 week ago vs current:
What we see here is rather a slow kind of grind up in SPX tail puts, but we can see the spike in tail calls into next Friday.
Lets look at VIX into March 17 Vix expo:
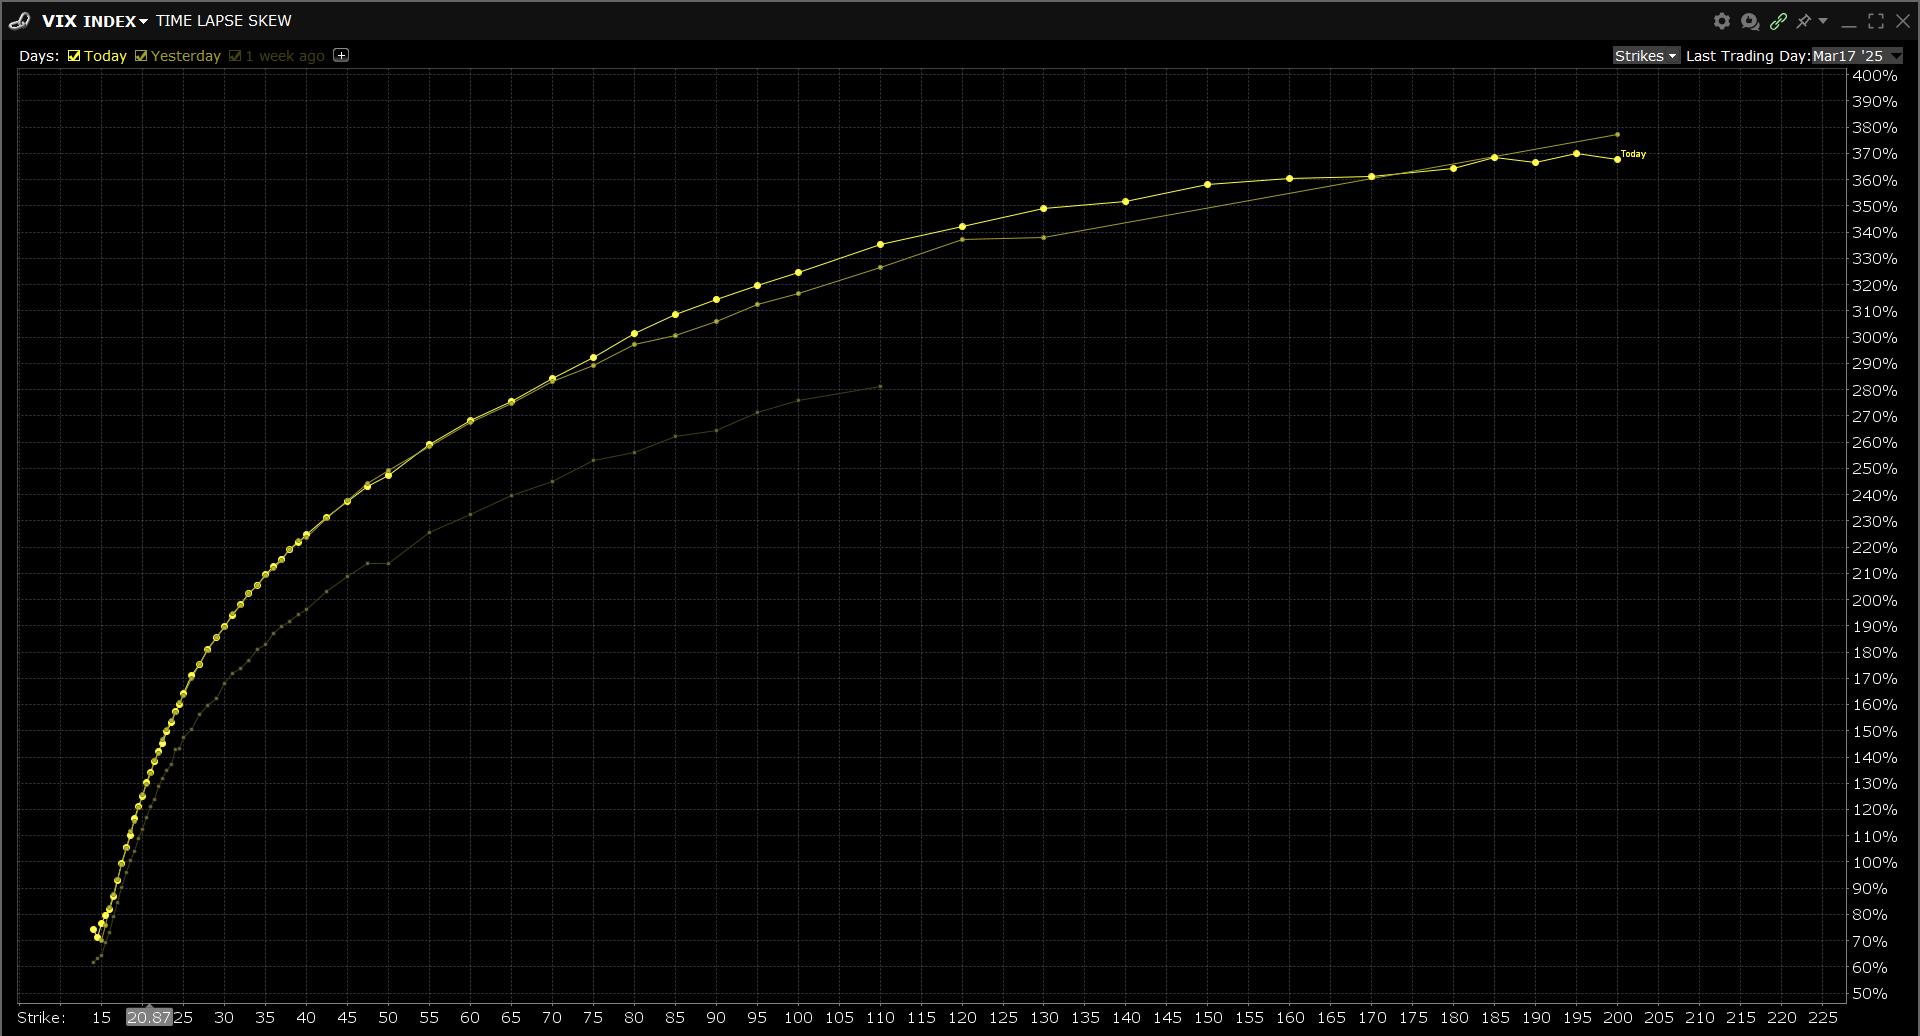
Now, here we see some significant increase during the week in the 42C and 60C IVs (like ~30 bps), not as much as what we would expect, but its there.
Note, that we don’t see this kind of change into April or May VIX expos:
This tells me more lika a ‘sticky high VIX’ environment that is hedges due to , than fear of left-tail event.
Similar with SPX, into March OpEx, 5-10 delta puts at 5450 - 5220 are rather decreased relative to post-NVDA ER than increased, while right wing is bid:
Same with April and May:
So, these higher order activities are rather noise for now than actual left-tail concerns. This, along with my reversion signals puts me like more the call side than the put side.
Mean reversion
The probability for a mean reversion up is pretty much elevated. Both of my models now give green signals, the more sensitive one too:
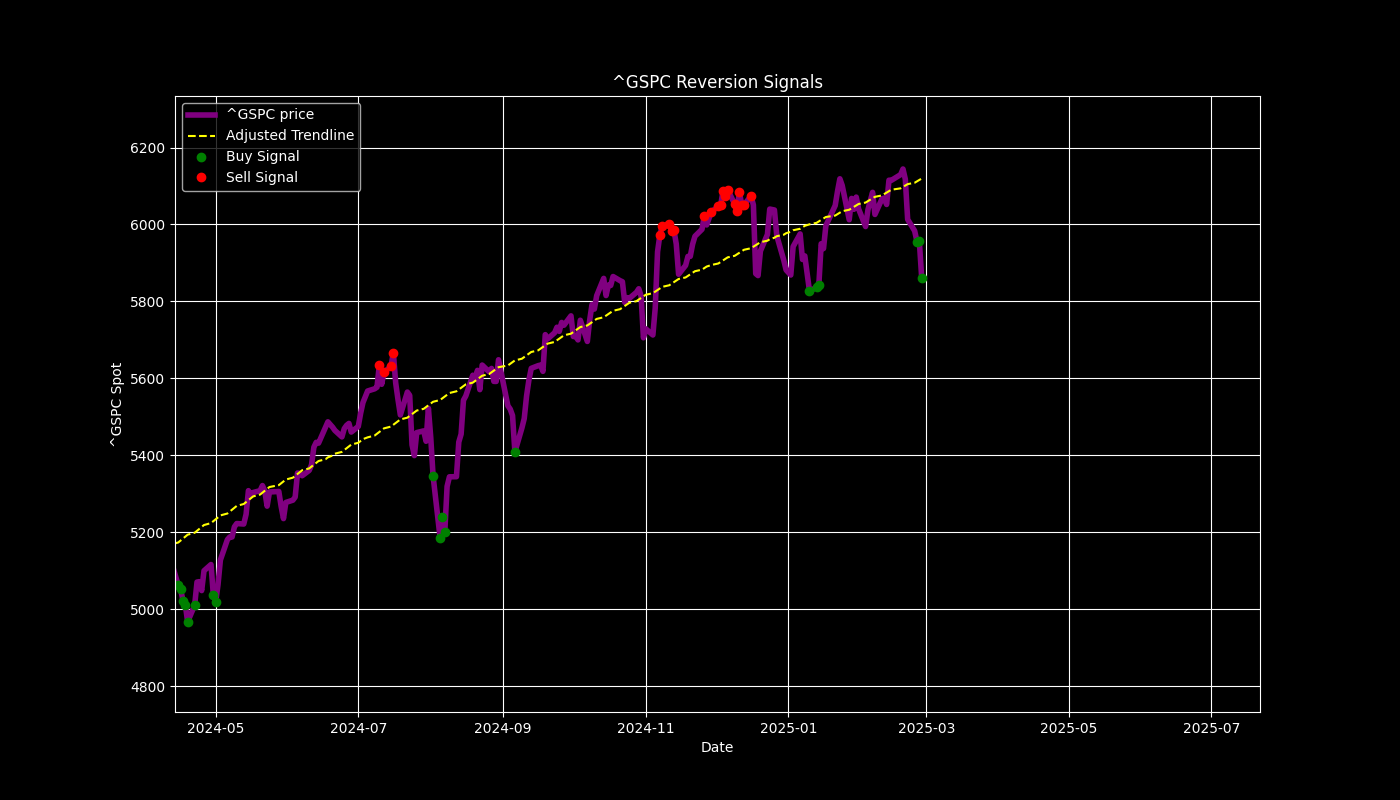
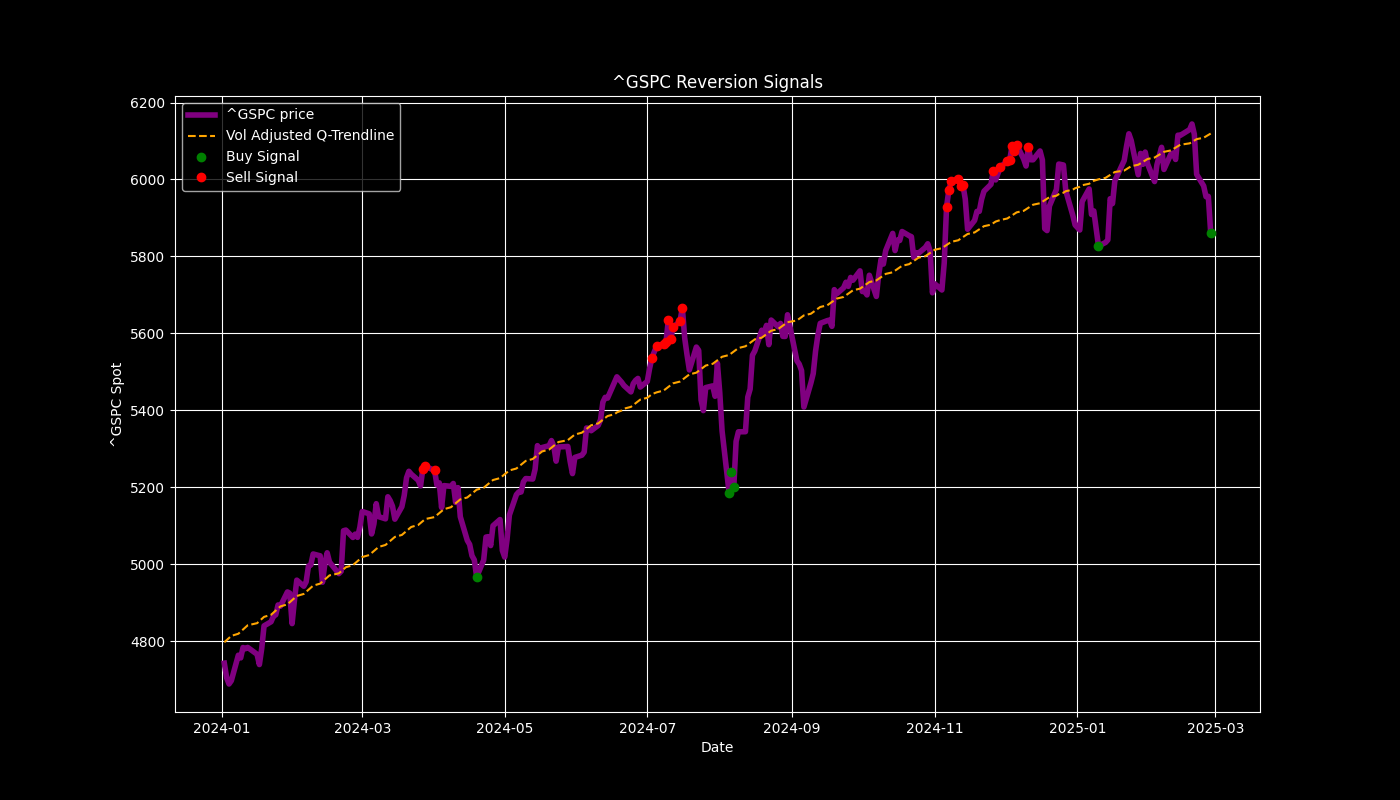
Model says that for the short-term upward momentum, spot needs to conquer 5953.38
For the longer-term, the lvl is 6119.32
Note, that this is a negative skewed probability distirbution. And this tells higher probability for up than down from here, temporary. Negative event have lower probability, but higher impact.
I hedge the left-tail, while going for intraday call edge.
SCRIPT INPUTS:
SPX
99.73%, 5975.579154580438, , 5947.008520566266, 95.4%, 5918.574489399594, Risk level, 5899.990968550639, 68.2%, 5890.0031943502, 68.2%, 5832.997855213741, Risk level, 5823.148679886861, 95.4%, 5804.565159037906, , 5775.992502774342, 99.73%, 5747.560493857062
ES=F
99.73%, 5998.026221140234, , 5967.504509066629, 95.4%, 5937.138110570117, Risk level, 5917.288586524259, 68.2%, 5906.615597974668, 68.2%, 5845.726670206395, Risk level, 5835.211413475741, 95.4%, 5815.361889429883, , 5784.837725235225, 99.73%, 5754.473778859766
SPY
99.73%, 596.854980741867, , 593.8963997338158, 95.4%, 590.952484267418, Risk level, 589.0282704167474, 68.2%, 587.9938296503437, 68.2%, 582.0912580740483, Risk level, 581.0717051691901, 95.4%, 579.1474913185195, , 576.1886849590514, 99.73%, 573.2449948440704
VIX
99.73%, 22.776760447743786, , 22.361280661443722, 95.4%, 21.953379804255196, Risk level, 21.684957714477914, 68.2%, 21.537755148573464, 68.2%, 20.714218117710644, Risk level, 20.57504060705529, 95.4%, 20.306618517278007, , 19.89066813821055, 99.73%, 19.483237873789417
IWM
99.73%, 218.373583141256, , 216.8725282326438, 95.4%, 215.38179126545222, Risk level, 214.40646711394018, 68.2%, 213.8806641924669, 68.2%, 210.88879810473324, Risk level, 210.3735316653567, 95.4%, 209.39820751384465, , 207.8969298810431, 99.73%, 206.40641563804087
QQQ
99.73%, 513.6291548591192, , 510.2784339847052, 95.4%, 506.94957193639556, Risk level, 504.7720279035876, 68.2%, 503.5987060975299, 68.2%, 496.9189743130891, Risk level, 495.7679501237561, 95.4%, 493.5904060909482, , 490.2392384720768, 99.73%, 486.91082316822445
NQ=F
99.73%, 21185.750431203232, , 21040.250691008816, 95.4%, 20895.750215601616, Risk level, 20801.21014531549, 68.2%, 20750.243492670947, 68.2%, 20460.236096386252, Risk level, 20410.28985468451, 95.4%, 20315.749784398384, , 20170.2284936165, 99.73%, 20025.749568796768
NVDA
99.73%, 128.74654787075315, , 126.57916793801175, 95.4%, 124.44827469831603, Risk level, 123.04703764410152, 68.2%, 122.28025349538521, 68.2%, 117.98129232400254, Risk level, 117.25296540765629, 95.4%, 115.85172835344179, , 113.68227912263897, 99.73%, 111.55345518100468
AMZN
99.73%, 217.1019547003299, , 215.00130459072525, 95.4%, 212.920980096747, Risk level, 211.55798237597895, 68.2%, 210.82012843892502, 68.2%, 206.6389441309829, Risk level, 205.92202861034917, 95.4%, 204.55903088958112, , 202.45775116157378, 99.73%, 200.3780562859982
GOOG
99.73%, 177.49881785006667, , 175.66716442769618, 95.4%, 173.85441228196694, Risk level, 172.6663360667664, 68.2%, 172.02255864202527, 68.2%, 168.37794418901902, Risk level, 167.75367736096797, 95.4%, 166.56560114576743, , 164.73332049340038, 99.73%, 162.9211955776677
TSLA
99.73%, 304.4718177561441, , 298.7883201706289, 95.4%, 293.2109149815877, Risk level, 289.5398606770823, 68.2%, 287.5253398542352, 68.2%, 276.2621901542024, Risk level, 274.3601637369802, 95.4%, 270.6891094324748, , 264.99884947277786, 99.73%, 259.4282066579184
TSM
99.73%, 190.66219760144878, , 188.25393788661427, 95.4%, 185.8760969696697, Risk level, 184.31582816370974, 68.2%, 183.46744048887498, 68.2%, 178.68092183491663, Risk level, 177.8641645120715, 95.4%, 176.30389570611155, , 173.8943801694791, 99.73%, 171.51779507433247
AMD
99.73%, 105.4714736573265, , 103.97042445907407, 95.4%, 102.49073789677848, Risk level, 101.51901803883983, 68.2%, 100.98937343627924, 68.2%, 98.00830323627137, Risk level, 97.5009862336211, 95.4%, 96.52926637568245, , 95.02721205424264, 99.73%, 93.54853061513444
Gday Alma
1)
""there is not enough intraday edge on the puts side bcs the trade is crowded. However the call side edge is better bcs of the underpriced odds" please can you show with skew what mean
2)
I understan from your educational post the odds, when we can finds mispricing, example WS overpriced volatility so the odds are overpriced and the sellers has an edge but if you explain and show examples with skew graphic in different enviroment and where the odds are underpriced and why the probability are more for one said and another for me can be more clear
Thanks
if Lionel Messi were a quant... how do I get long Alma? :)