CPI, credit spreads, Stagflation, QT + Intraday post (13/May)
SPX/LTY correlation, Yields, Credit spreads, CPI, Stagflation, Intraday post
Trump’s landed in Saudi. This is a pivotal event.
Meanwhile the White House is weighing a deal to export hundreds of thousands of U.S. AI-grade chips to G42, a UAE AI champion—an unprecedented pivot in export controls. Signaling that geopolitical lines around technology are fluid, injecting fresh uncertainty into semis and tech valuations. Potentially broadening chip supply could ease tech-hardware inflation pressure—but may provoke pushback if national-security concerns rise.
This is what I’m keep saying, that the stagflationary pressures can be eased, and economy can be bailed out if good deals are done. But the final boss is China.
DYNAMICS
1) SPX/LTY correlation
Equity–yields correlation has jumped to ~70 bps over the past week (from -22% to 52%), signaling that inflation surprises (and hence inflation expectations) have become the primary driver of both yields and equity returns, rather than growth surprises. This abrupt flip resembles the mid-2021 shift documented by the BIS: once inflation is volatile enough, positive correlations persist and diversification benefits fade.
Crucial, because the stock–bond correlation depends not on the level of inflation per se but on the relative volatility of growth vs. inflation surprises and their covariance. When inflation uncertainty rises, its shocks loom larger, flipping correlations positive and eroding bonds’ hedge role. With equities and bonds moving together, passive portfolios demand extra compensation for undiversified bond risk, pushing term premia—and long yields—higher over time.
CPI expectations remain elevated above the Fed’s 2% goal: April headline is seen at +0.2% m/m (2.4% y/y), core at +0.3% m/m (2.8% y/y), with current‐quarter annualized CPI ≈ 3.0%, year‐ahead consumer survey at 3.6%, and 5-year breakevens near 2.39%
So, basically consensus forecasts expect the April CPI to show inflation was firmer than previously thought, signaling that price pressures remain sticky and complicating the Fed’s calculus for rate cuts.
Below-consensus CPI prints will now tend to lower long yields (bond prices up) and boost equities—unlike a growth regime, where yields and stocks would diverge. Good inflation news are good for both.
While above-consensus inflation prints push yields up (bond prices down) and dent stocks, creating a one-two punch to multi-asset portfolios. Bad inflation news are bad for both.
2) U.S. 10-Year Treasury Yield
Yields fell below 4.00 % in early April (betting on rapid Fed cuts and tariff relief), then surged back above 4.40 % as the Fed held rates and liquidity tightened.
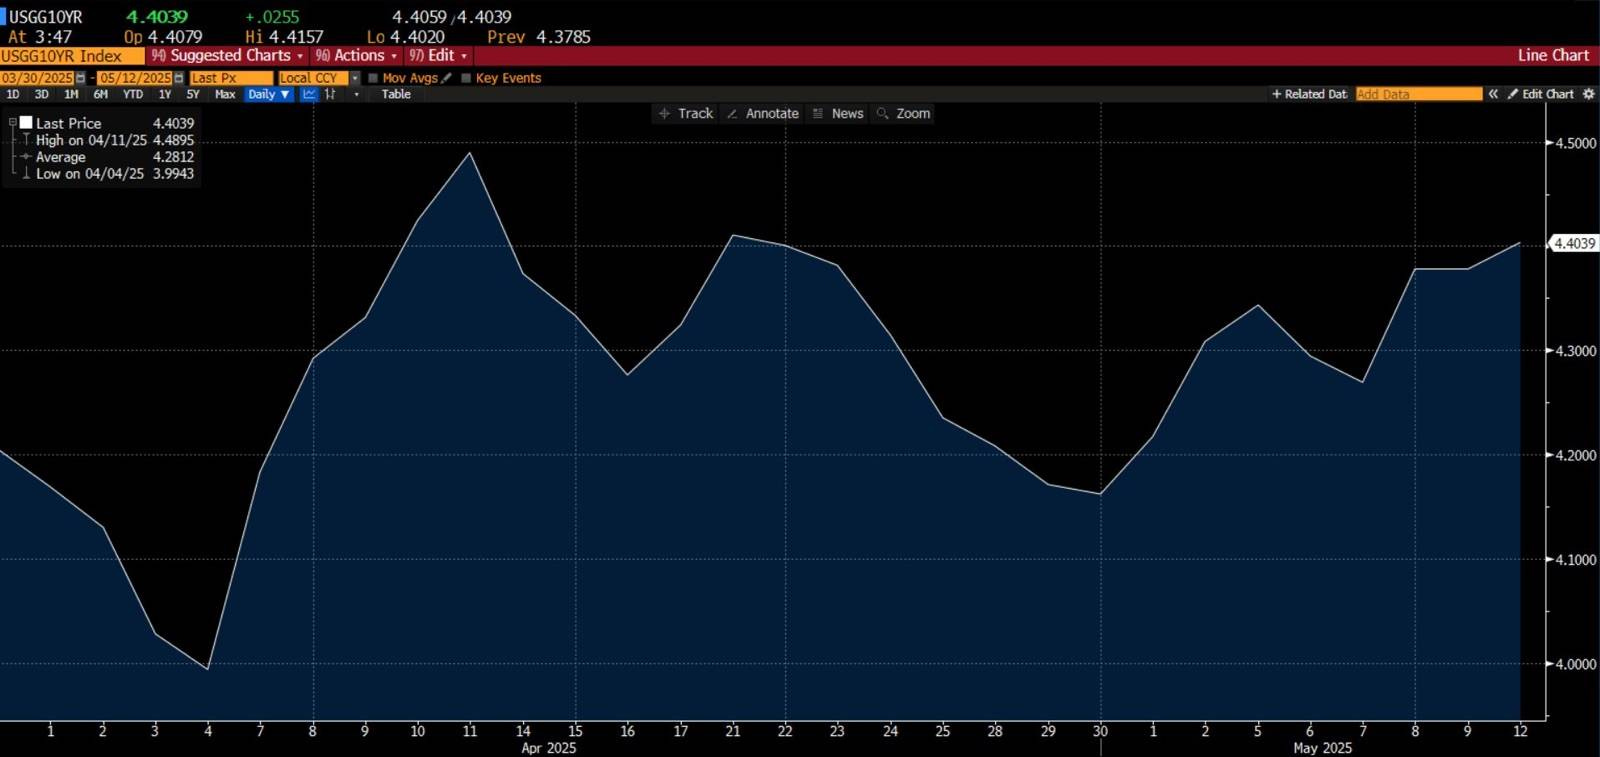
The rebound from 4.00 % to 4.40–4.50 % shows markets now price a delayed Fed easing cycle—term premia have widened as fixed-income investors demand extra compensation for holding long bonds in a volatile, policy-driven regime.
Breakeven inflation (10-year TIPS spread) stood at 2.29 % on May 9, reflecting that markets still expect inflation near the Fed’s 2 % target over the next decade.
With longer spiked SPX to LTY correlation, this means that good inflation news (below-expectation CPI) will now lower yields and lift equities—as both bond risk premia and equity discount rates ease; while bad inflation news (above-expectation CPI) will raise yields and hurt stocks in tandem, compressing traditional 60/40 diversification benefits.
4.30–4.50 % likely holds as long as policy and tariff risks remain front-and-center; a sustained move below 4.20 % would require markedly weaker data or fresh Fed dovish signals.
Any surprise in inflation prints or a sudden liquidity squeeze (e.g., repo-market stress) could send yields rapidly through the 4.50 % handle—and rip equity valuations.
3) CDX High-Yield 5Y Spread
The credit-default-swap spread on the 5-year high-yield index spiked from ~300 bps in December to a peak near 476 bps in early April (tariff shock/freight-bottle-neck worry), then retraced to ~350 bps today.
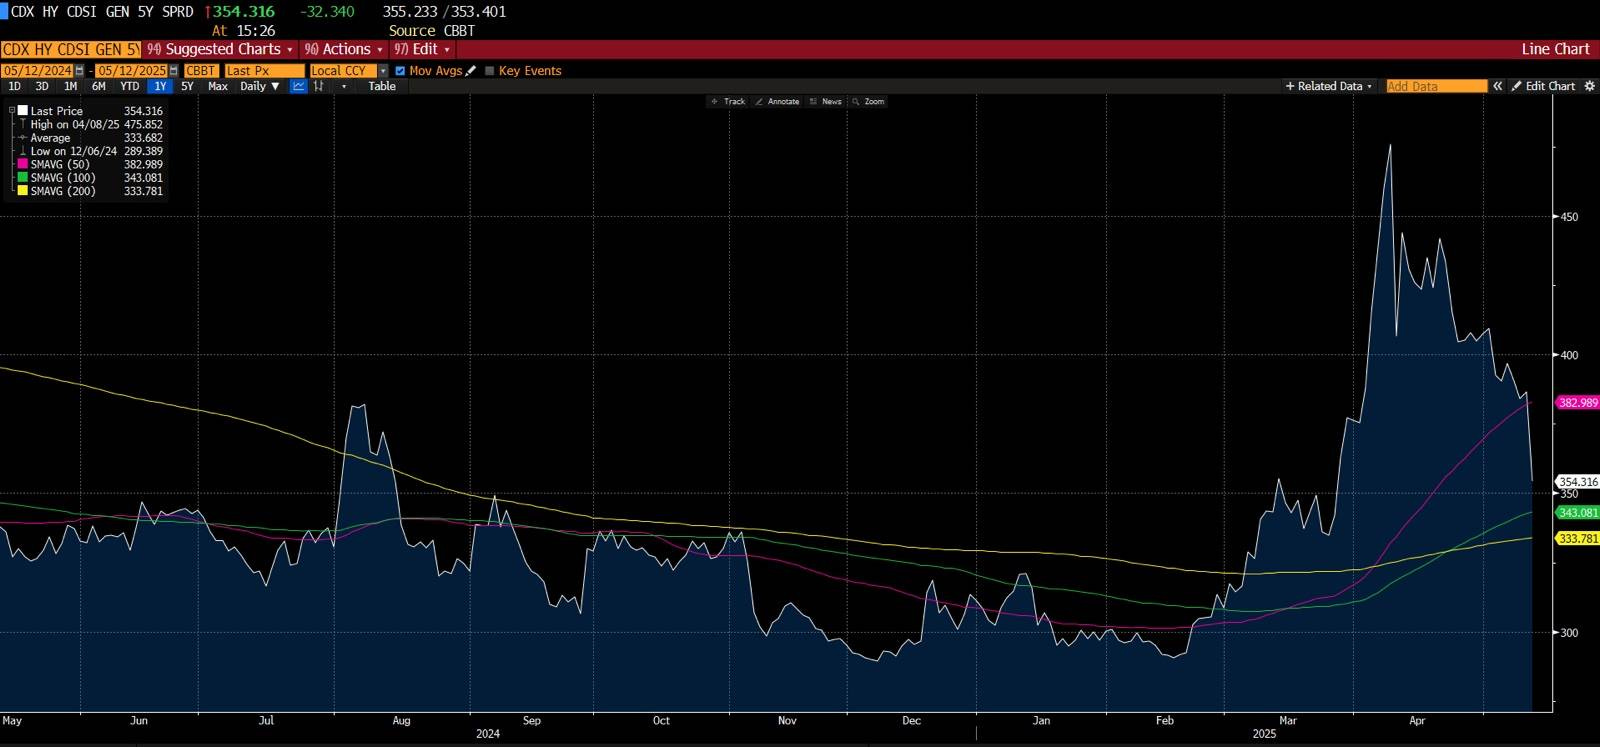
It’s above its 100- and 200-day averages—indicating that, on balance, credit stress remains elevated vs. long-term norms. But it’s below its 50-day average, suggesting a partial cooldown from the spike but not a return to “healthy” levels.
A steep curve in CDS spreads (with shorter tenors widening more) can foreshadow mounting default concerns; the high-yield 5-year contract’s stubborn elevation implies that near-term funding strains are priced into credit protections.
Spreads north of both long-run averages demonstrate investors demand extra compensation for tail risks in the high-yield universe. If a fresh catalyst (e.g., hawkish Fed remarks or tariff escalations) hits, we will see renewed stress, since dealers and funds remain underhedged in face of a tighter liquidity backdrop.
In a good-news regime, we’d expect spreads to compress back toward long-term averages and equity risk-premia to narrow. In a bad-news regime, spreads would re-widen sharply above short-term trends, denting high-yield debt and equity valuations in tandem.
So the key is, that the primary concern has shifted away from recession toward managing inflation risks.
Lose-lose for Fed
As I kept explaining since April Fed datas, Trump’s tariff policy forced the Fed into a lose-lose situation of choosing between steering the economy into recession or managing a period of stagflation. At its May 7 meeting, Fed officials unanimously decided to keep the benchmark rate unchanged while cautioning that tariffs posed dual threats of higher unemployment and higher inflation. As Powell said that sustained tariff increases “are likely to generate a rise in inflation, a slowdown in economic growth, and an increase in unemployment”. Stagflation.

Firmer-than-expected CPI readings imply the Fed may hold rates at restrictive levels longer, and any dovish pivot hinges on clear evidence of inflation easing back toward the 2 percent target. Get ready for sharp repricing of both rates and equities, if price‐report surprises.
VOLATILITY REGIME
Coding 1m, 3m realized volatility and vol of vol for SPX:
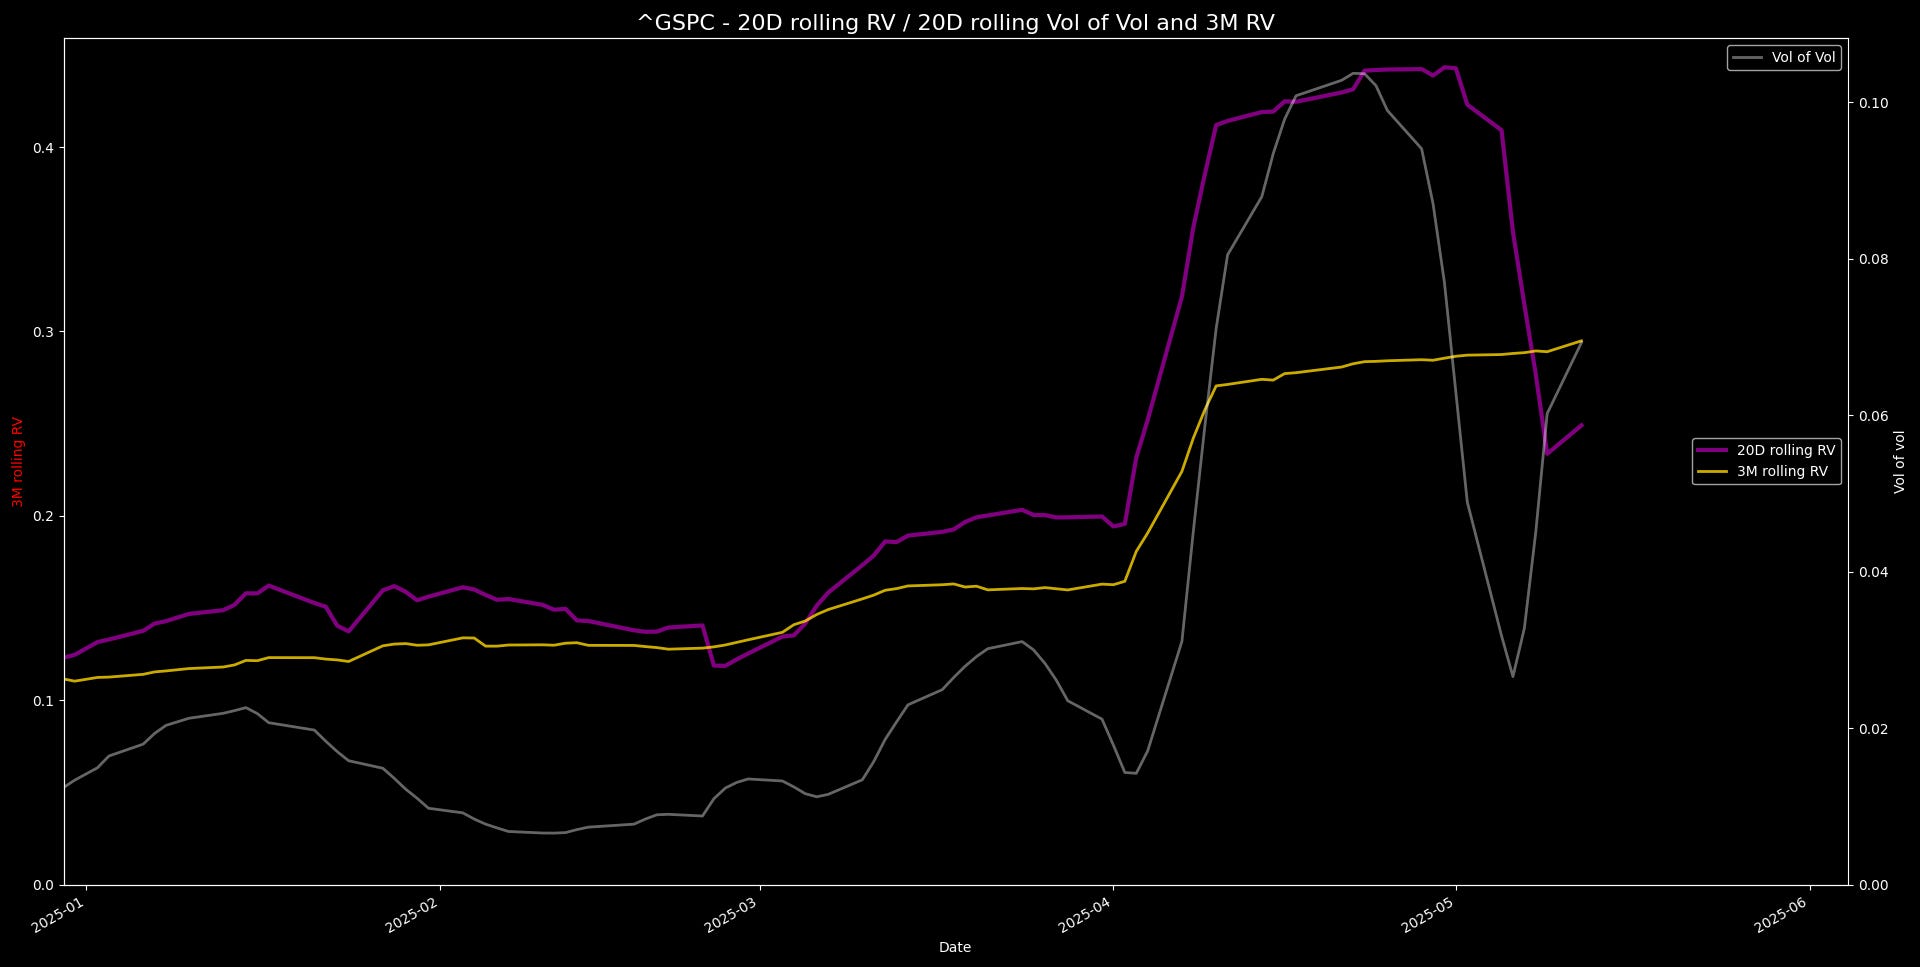
On a monthly basis, RV has fallen down to its 23.36% by May 9, while catched up to 24.90% during yesterday session. However on a three monthly basis, RV is stagnant and grinding up, currently trending at 29.48%
The sharp decrease in one monthly RV was simply caused by mathematics, once those four shock days began to roll off a 20-day window (by April 23, T+12; April 24, T+13; etc.), the 1m RV plunged—not because markets calmed, but because the biggest outliers left the sample. A 3m RV has longer memory.
Risk-parity, vol-targeting, risk-controlled indices compare the observed RV to a target and scale exposure by min(1, target/RV). Volatility-managed portfolios outperform by de-leveraging in high-vol regimes and increasing leverage when volatility subsides.
Until both windows fall below the vol-target threshold, vol-control strategies will remain cautious—hence minimal fresh buy flows even in the face of a low 1m RV.
The real reason is the vol of vol (VoV). Look how much it spiked…
This means that the mean of vol falls while its variance return distribution stays high, signaling fat tails, clustering, and higher sensitivity of risk measures to new shocks, also delta-hedged option returns are systematically negative when exposed to high VoV—investors pay up for the insurance against a volatile volatility regime. (Rough volatility models show that volatility paths are far more jagged than classical diffusions—implying persistent high VoV even if average vol is low.) There is a lot of mispricing risk here.
The takeaway is clear: don’t trust a single‐scale vol measure. 1m RV may signal “buy”, but VoV and 3m RV still signal “sell/neutral.” The result: vol-targeters sit on their hands, missing opportunities or being caught off-guard when RV re-spikes.
MEAN REVERSION
The first reversion model, signaling red dot at 5844.18 highs, targeting 5491.06 as the projected “cool off” point. 5664.86 is pivot

The model says 67.26% probability for reversion towards 5491.06
Size accordingly. The odds are relatively underpriced
May OpEx:

Jun OpEx:
Based on the VIX at 18.52% as of May 13, 2025, the one-sigma move over the next three trading days (to May 16) is about ±118 points, corresponding to a 68.2% probability of SPX remaining within that range and 31.8% of ending outside it.
The market assigns roughly a 17.3% chance of SPX < 5725 and a 15.7% chance of SPX > 5960 by May 16, as implied by the respective IVs.
This aligns with what VIX is showing us, even overestimated by a small 1.2 pts, that is natural and gives a bit more room for short VIX.
However, fo June OpEx, the VIX implies a one‐sigma move of ±5.98 % (≈±349 pts).
By June OpEx, risk-neutral odds for SPX < 5495 ≈ 18.5%, and for > 6195 ≈ 8.3%
This is an underpricing by 5%; not much but it is there. Note, VIX tends to underestimate the market moves, and these probabilities are derived from VIX.
If my model estimates the odds right (usually does), then this is a serious mispricing, and one should monitor carefully how it evolves.
Be careful, the divergence arises because the Q-measure strips out the mean-reversion drift and adds a volatility risk premium/skew. What I mean is that mean-reverting processes produce physical probabilities that account for a drift back toward a long-term mean, calibrated to historical data and true-world dynamics, while risk-neutral probabilities are derived from market option prices under an equivalent martingale (Q) measure and ignoring real-world drift in favor of no-arbitrage pricing.
The market’s risk-neutral probabilities understate that physical likelihood by ~40 pp, if my model is right, but no arbitrage opportunity.
The subject of this underestimation
is coming from several risks. Market has run out of steam after Opex hedging flows, needs to fill key gap levels, is underpinned by rising trade deficits, tight credit/funding conditions, and inflationary supply shocks from tariffs and freight (these shocks push up costs for raw materials, shipping, and finished goods—even as demand cools, you won’t see these immediately in headline CPI; they show up first in wholesale prices, margin compression, then eventually feed into consumer prices), and likely to retest or breach prior lows before enough volatility and macro data calm down to rebuild a bullish technical structure.
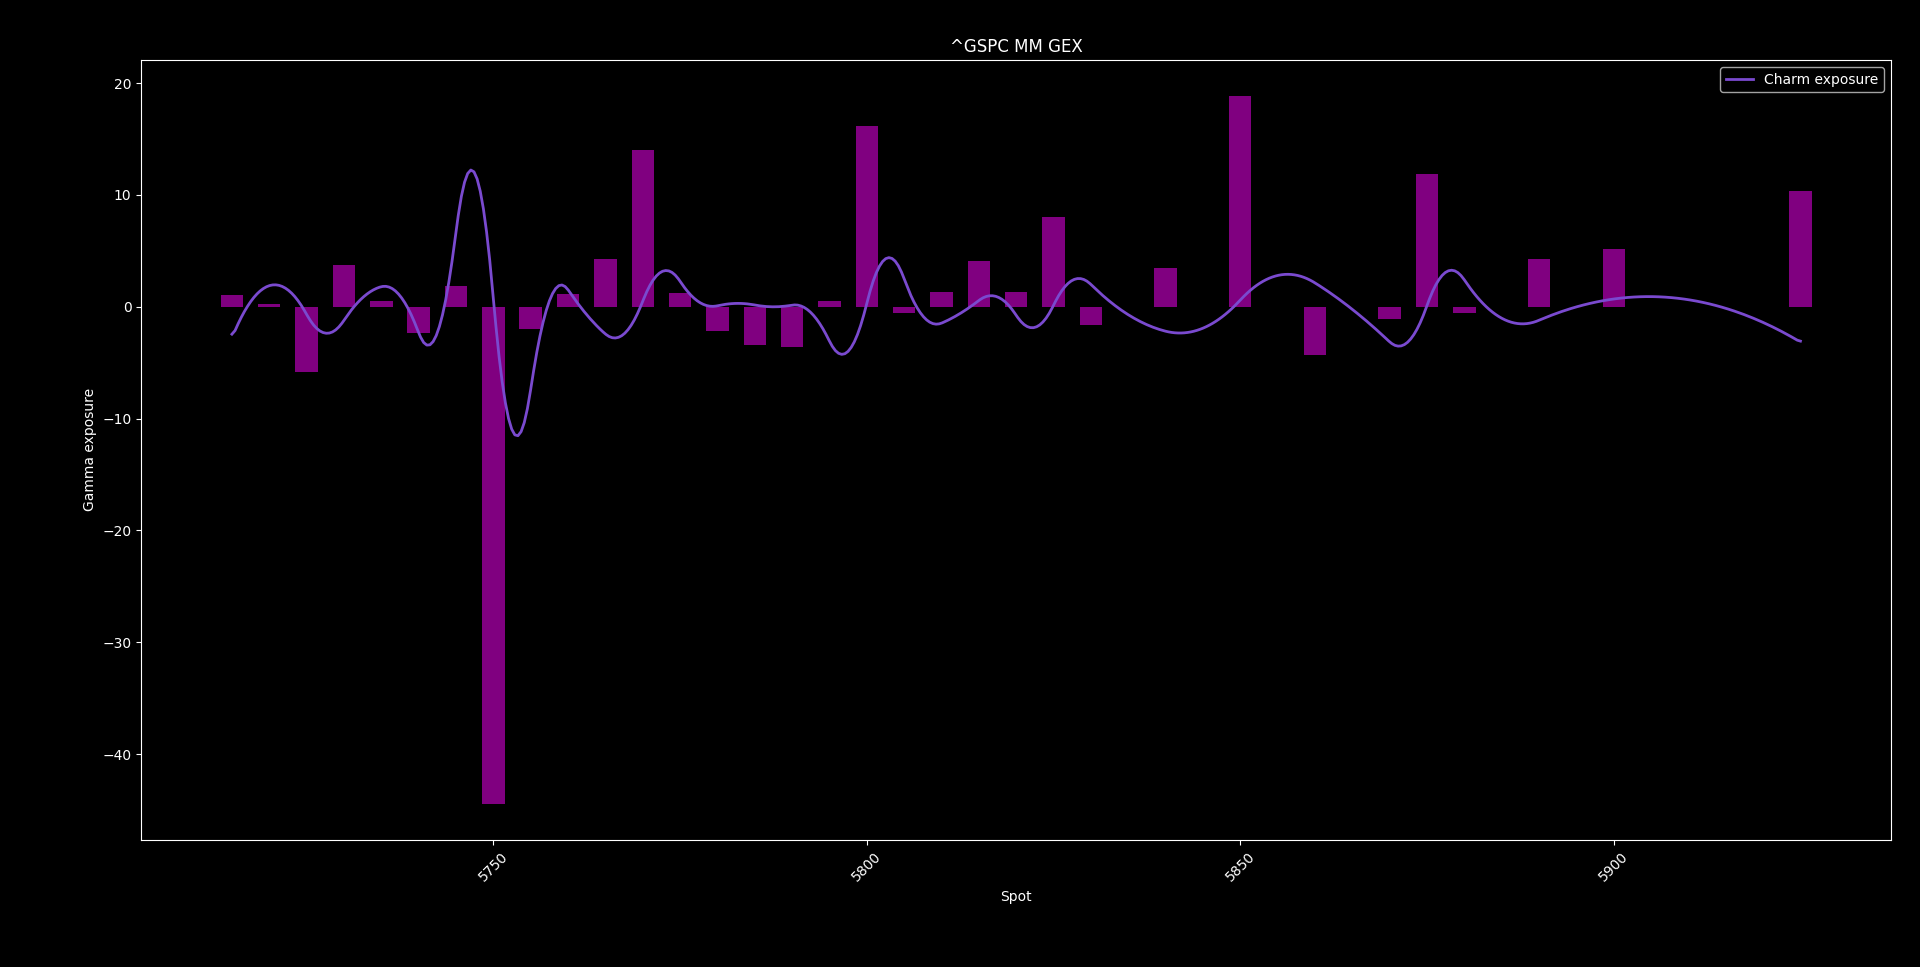
INTRADAY POST
Coding today’s positioning: